ASPECt 3D
![]() 3D Energy Tasks
3D Energy Tasks
![]() Uncontrolled systems always evolve toward more stable states--that is, toward more uniform energy distribution.
Uncontrolled systems always evolve toward more stable states--that is, toward more uniform energy distribution.
Item AP049004: Predict how the temperature and the energy of the gases in two systems will change when the systems are allowed to be in contact with each other.

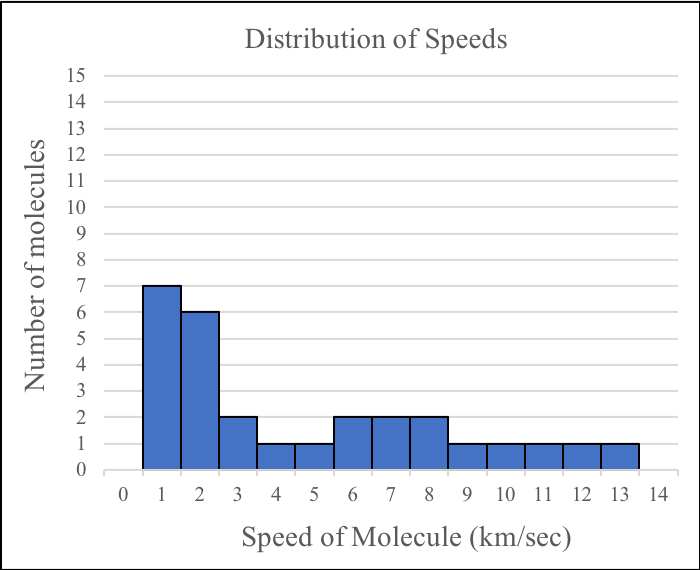
One-way that scientists model the behavior of gases is to represent the molecules that make up the gas as small spheres colliding with each other.
Below is a diagram representing a model of a gas in a box (the model is not to scale). Each molecule of the gas is represented as a black circle. The direction that a molecule is moving is represented by an arrow. The length of the arrow represents how fast the molecule is moving, with longer arrows representing faster molecules.
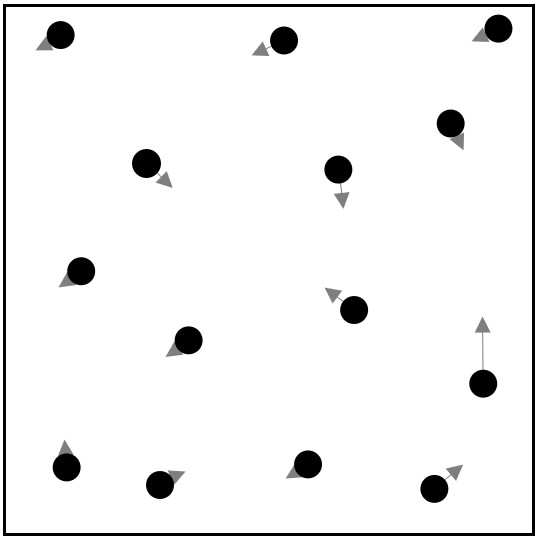
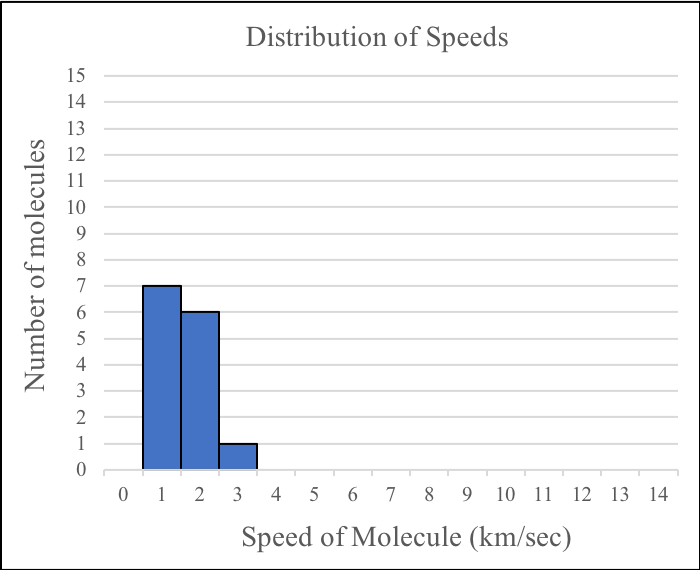
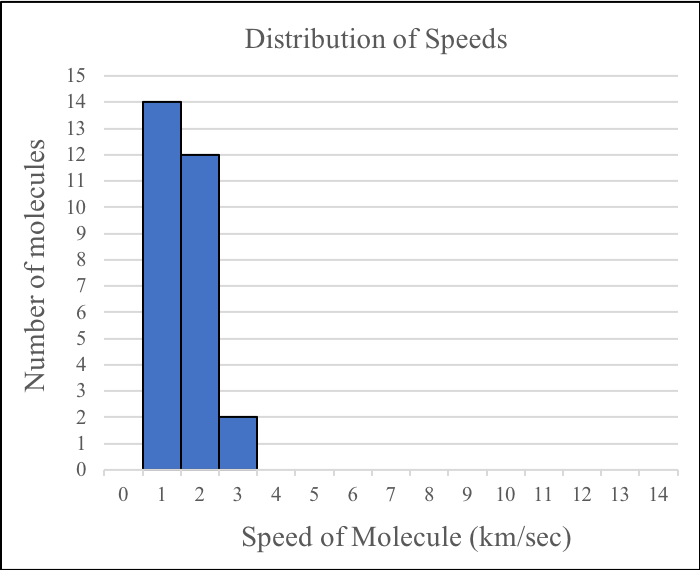
Notice that the molecules are moving at different speeds with most of them moving quite slowly. Below is a plot of the distribution of speeds for the diagram above.
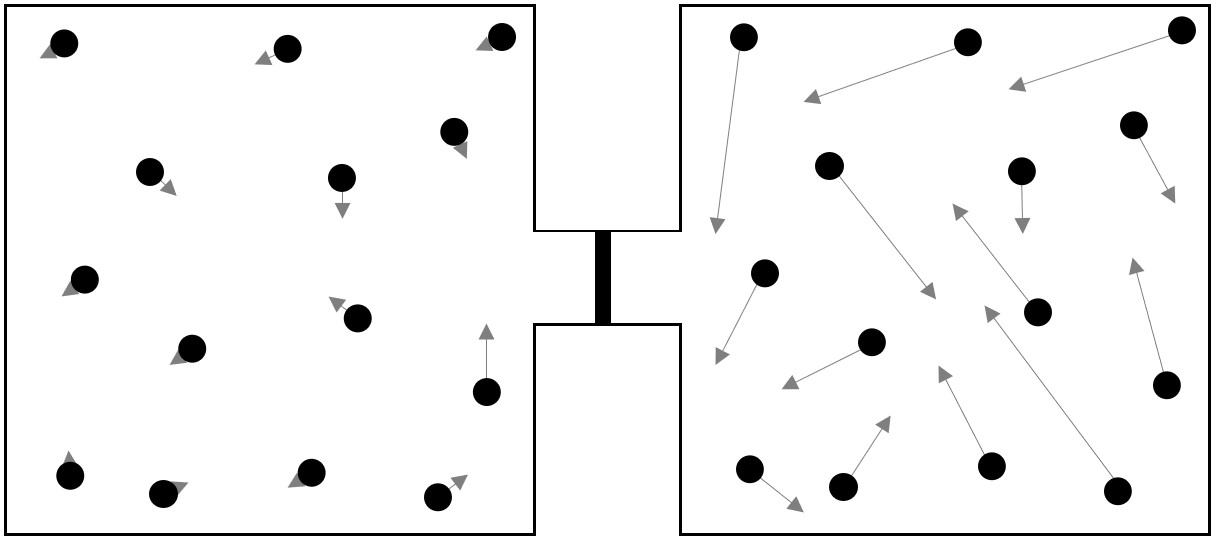
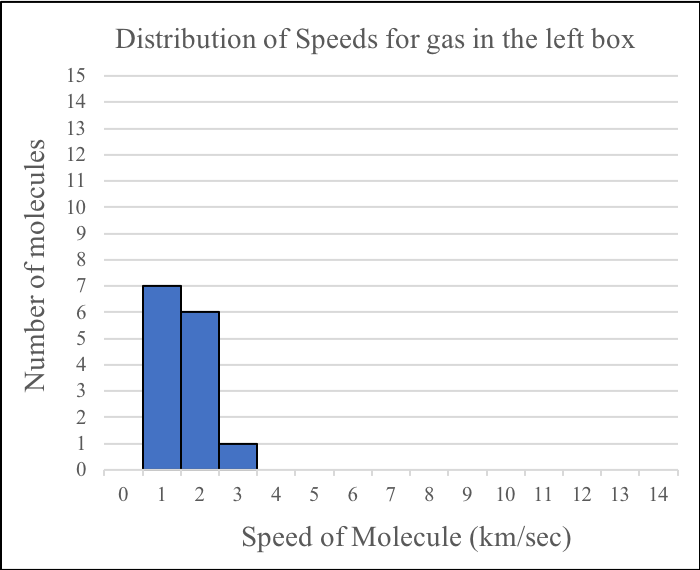
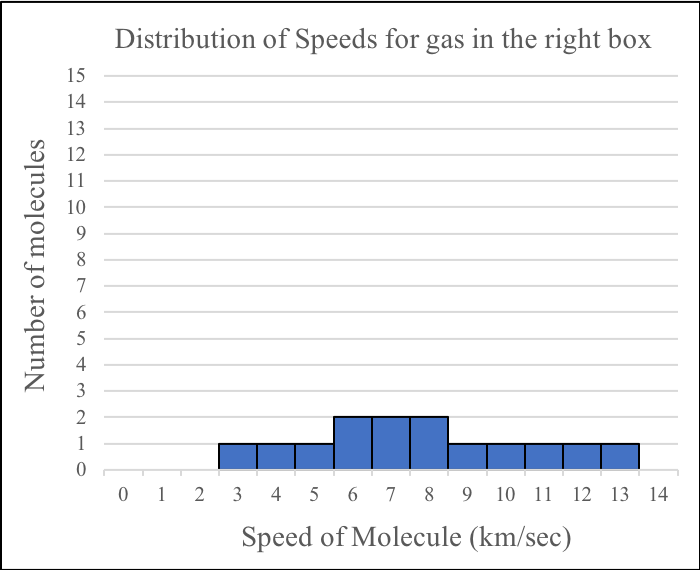
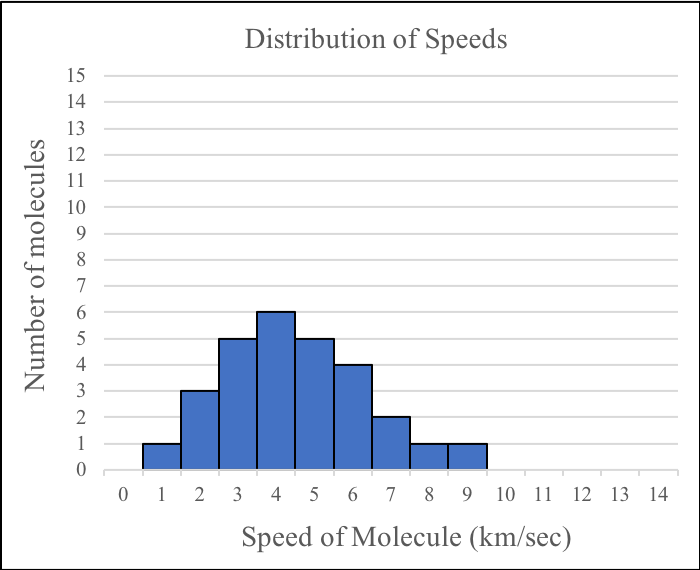
A scientist wants to simulate how the speeds of the molecules in two samples of gas change when the samples mix. He uses two boxes, each containing molecules with different average speeds. The boxes are connected by a tube containing an insulated wall that prevents the transfer of matter and energy between the samples. Below is a diagram showing the scientist’s simulation and the distributions of speeds for the molecules in each box before they are allowed to mix.
Answer the following questions about the gases before they mix.
1. On average, which gas has faster moving molecules before they mix?
A. The molecules of the gas in the left box are moving faster than the molecules of the gas in the right box.
B. The molecules of the gas in the right box are moving faster than the molecules of the gas in the left box.
C. The molecules of both gases are moving at the same average speed.
2. Which gas has more energy before they mix?
A. The gas in the left box has more energy than the gas in the right box.
B. The gas in the right box has more energy than the gas in the left box.
C. Both gases have the same amount of energy.
3. How do the temperature of the gases compare before they mix?
A. The gas in the left box has a higher temperature than the gas in the right box.
B. The gas in the left box has a lower temperature than the gas in the right box.
C. Both gases have the same temperature.
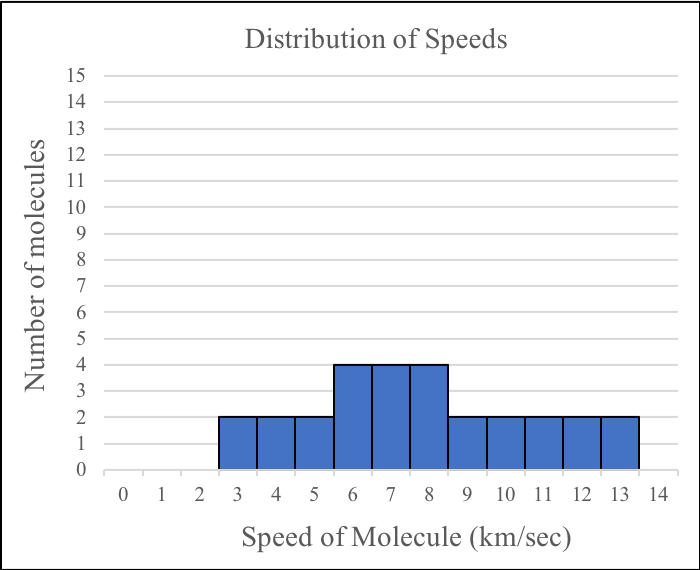
4. If you were to combine the speed data for the molecules in the two boxes before the gases were mixed, which of the following would best represent the overall distribution of speeds before the molecules have started to mix?
| A. |
|
B. |
|
| C. |
|
D. |
|
At the start of the simulation, the scientist removes the wall that prevents the transfer of matter and energy between the two boxes. As the molecules mix, they only interact with each other through collisions and no chemical reactions occur. The scientist runs the simulation until the molecules are thoroughly mixed and the average speed of the molecules in each box is the same.
Answer the following questions about the gases at the end of the simulation after they have thoroughly mixed.
5. How will the molecules be distributed in the two boxes at the end of the simulation?
A. There will be the same number of molecules in each box at the end of the simulation.
B. The box on the left will have more molecules than the box on the right at the end of the simulation.
C. The box on the left will have fewer molecules than the box on the right at the end of the simulation.
6. How will energy be distributed in the two boxes at the end of the simulation?
A. On average, the molecules in the box on the left will have less energy than molecules that are in the box on the right.
B. On average, the molecules in the box on the left will have more energy than the molecules in the box on the right.
C. On average, the molecules in the box on the left will have the same amount of energy as the molecules in the box on the right.
7. How will the temperature of the gases in the two boxes change as the gases mix?
A. The temperature of the gas in the box on the left will increase and the temperature of the gas in the box on the right will increase.
B. The temperature of the gas in the box on the left will increase and the temperature of the gas in the box on the right will decrease.
C. The temperature of the gas in the box on the left will decrease and the temperature of the gas in the box on the right will decrease.
D. The temperature of the gas in the box on the left will decrease and the temperature of the gas in the box on the right will increase.
8. Which of the following would best represent the overall distribution of speeds for the molecules on both sides after the simulation has run for a long time and after the gases have thoroughly mixed?
| A. |
|
B. |
|
| C. |
|
D. |
|
9. Using what you know about energy transfer, explain why the average speed of the molecules in each box eventually becomes the same.
- Topic
- 3D Energy Tasks
- Scoring Rubric
-
Q1
-
Student selects answer choice B
- B. The molecules of the gas in the right box are moving faster than the molecules of the gas in the left box.
-
Q2
-
Student selects answer choice B
- B. The gas in the right box has more energy than the gas in the left box.
-
Q3
-
Student selects answer choice B
- B. The gas in the left box has a lower temperature than the gas in the right box.
-
Q4
-
Student selects answer choice B
- B.

-
Q5
-
Student selects answer choice A
- A. There will be the same number of molecules in each box at the end of the simulation.
-
Q6
-
Student selects answer choice C
- C. On average, the molecules in the box on the left will have the same amount of energy as the molecules in the box on the right.
-
Q7
-
Student selects answer choice B
- B. The temperature of the gas in the box on the left will increase and the temperature of the gas in the box on the right will decrease.
-
Q8
-
Student selects answer choice A
- A.

-
Q9
-
1. Student states or uses a general science idea
- Temperature is a measure of the average kinetic energy or speed of particles of matter (i.e. Molecules making up the higher temperature gas have more average kinetic energy or speed than the molecules making up the lower temperature gas) [links temperature and molecular kinetic energy/speed]
- When two objects interact, each one exerts a force on the other that can cause energy to be transferred (i.e., When molecules collide, they transfer energy to one another changing their speeds). [links collisions and energy transfer]
- Uncontrolled systems always evolve toward more stable states (i.e., overtime the energy will become evenly distributed between the gases). [uniform energy distribution]
2. Student uses reasoning based on valid science ideas to support the observation
- The transfer of energy from (or collisions of) faster moving molecules to slower moving molecules will cause the new average speed of the combined gas to be somewhere between the average speed of the two gases before they were allowed to mix.
- Percent of Points Earned

- Points Earned
| Avg. Earned | Possible | Percent | |
|---|---|---|---|
| Q1 | 0.66 | 1 | 66% |
| Q2 | 0.53 | 1 | 53% |
| Q3 | 0.48 | 1 | 48% |
| Q4 | 0.43 | 1 | 43% |
| Q5 | 0.44 | 1 | 44% |
| Q6 | 0.52 | 1 | 52% |
| Q7 | 0.39 | 1 | 39% |
| Q8 | 0.28 | 1 | 28% |
| Q9 | 0.29 | 2 | 14% |
- Overall Task Difficulty
| Total Points Earned | Total Points Possible | Total Percent | |
|---|---|---|---|
| 4.01 | 10 | 40% |
n = 213
Note: The total percent is a weighted average based on the total number of points earned divided by the total number of points possible.
- Science and Engineering Practices
- SEP2 Use a model to predict the relationships between systems or between components of a system.
SEP4 Use graphical displays (e.g., maps, charts, graphs, and/or tables) of large data sets to identify temporal and spatial relationships.
SEP6 Construct an explanation using models or representations. - Crosscutting Concepts
- CC3 Time, space, and energy phenomena can be observed at various scales using models to study systems that are too large or too small.
CC4 Models can be used to predict the behavior of a system, but these predictions have limited precision and reliability due to the assumptions and approximations inherent in models. - Disciplinary Core Ideas
- PS3.A Temperature is a measure of the average kinetic energy of particles of matter. The relationship between the temperature and the total energy of a system depends on the types, states, and amounts of matter present.
PS3.B The availability of energy limits what can occur in any system.
PS3.B Uncontrolled systems always evolve toward more stable states--that is, toward more uniform energy distribution (e.g., water flows downhill, objects hotter than their surrounding environment cool down).