Item AP029006: In a device that creates water droplets by condensing water vapor, analyze data to make a prediction about whether the device would continue to produce water droplets if one section is kept at a constant temperature. (MC Version)
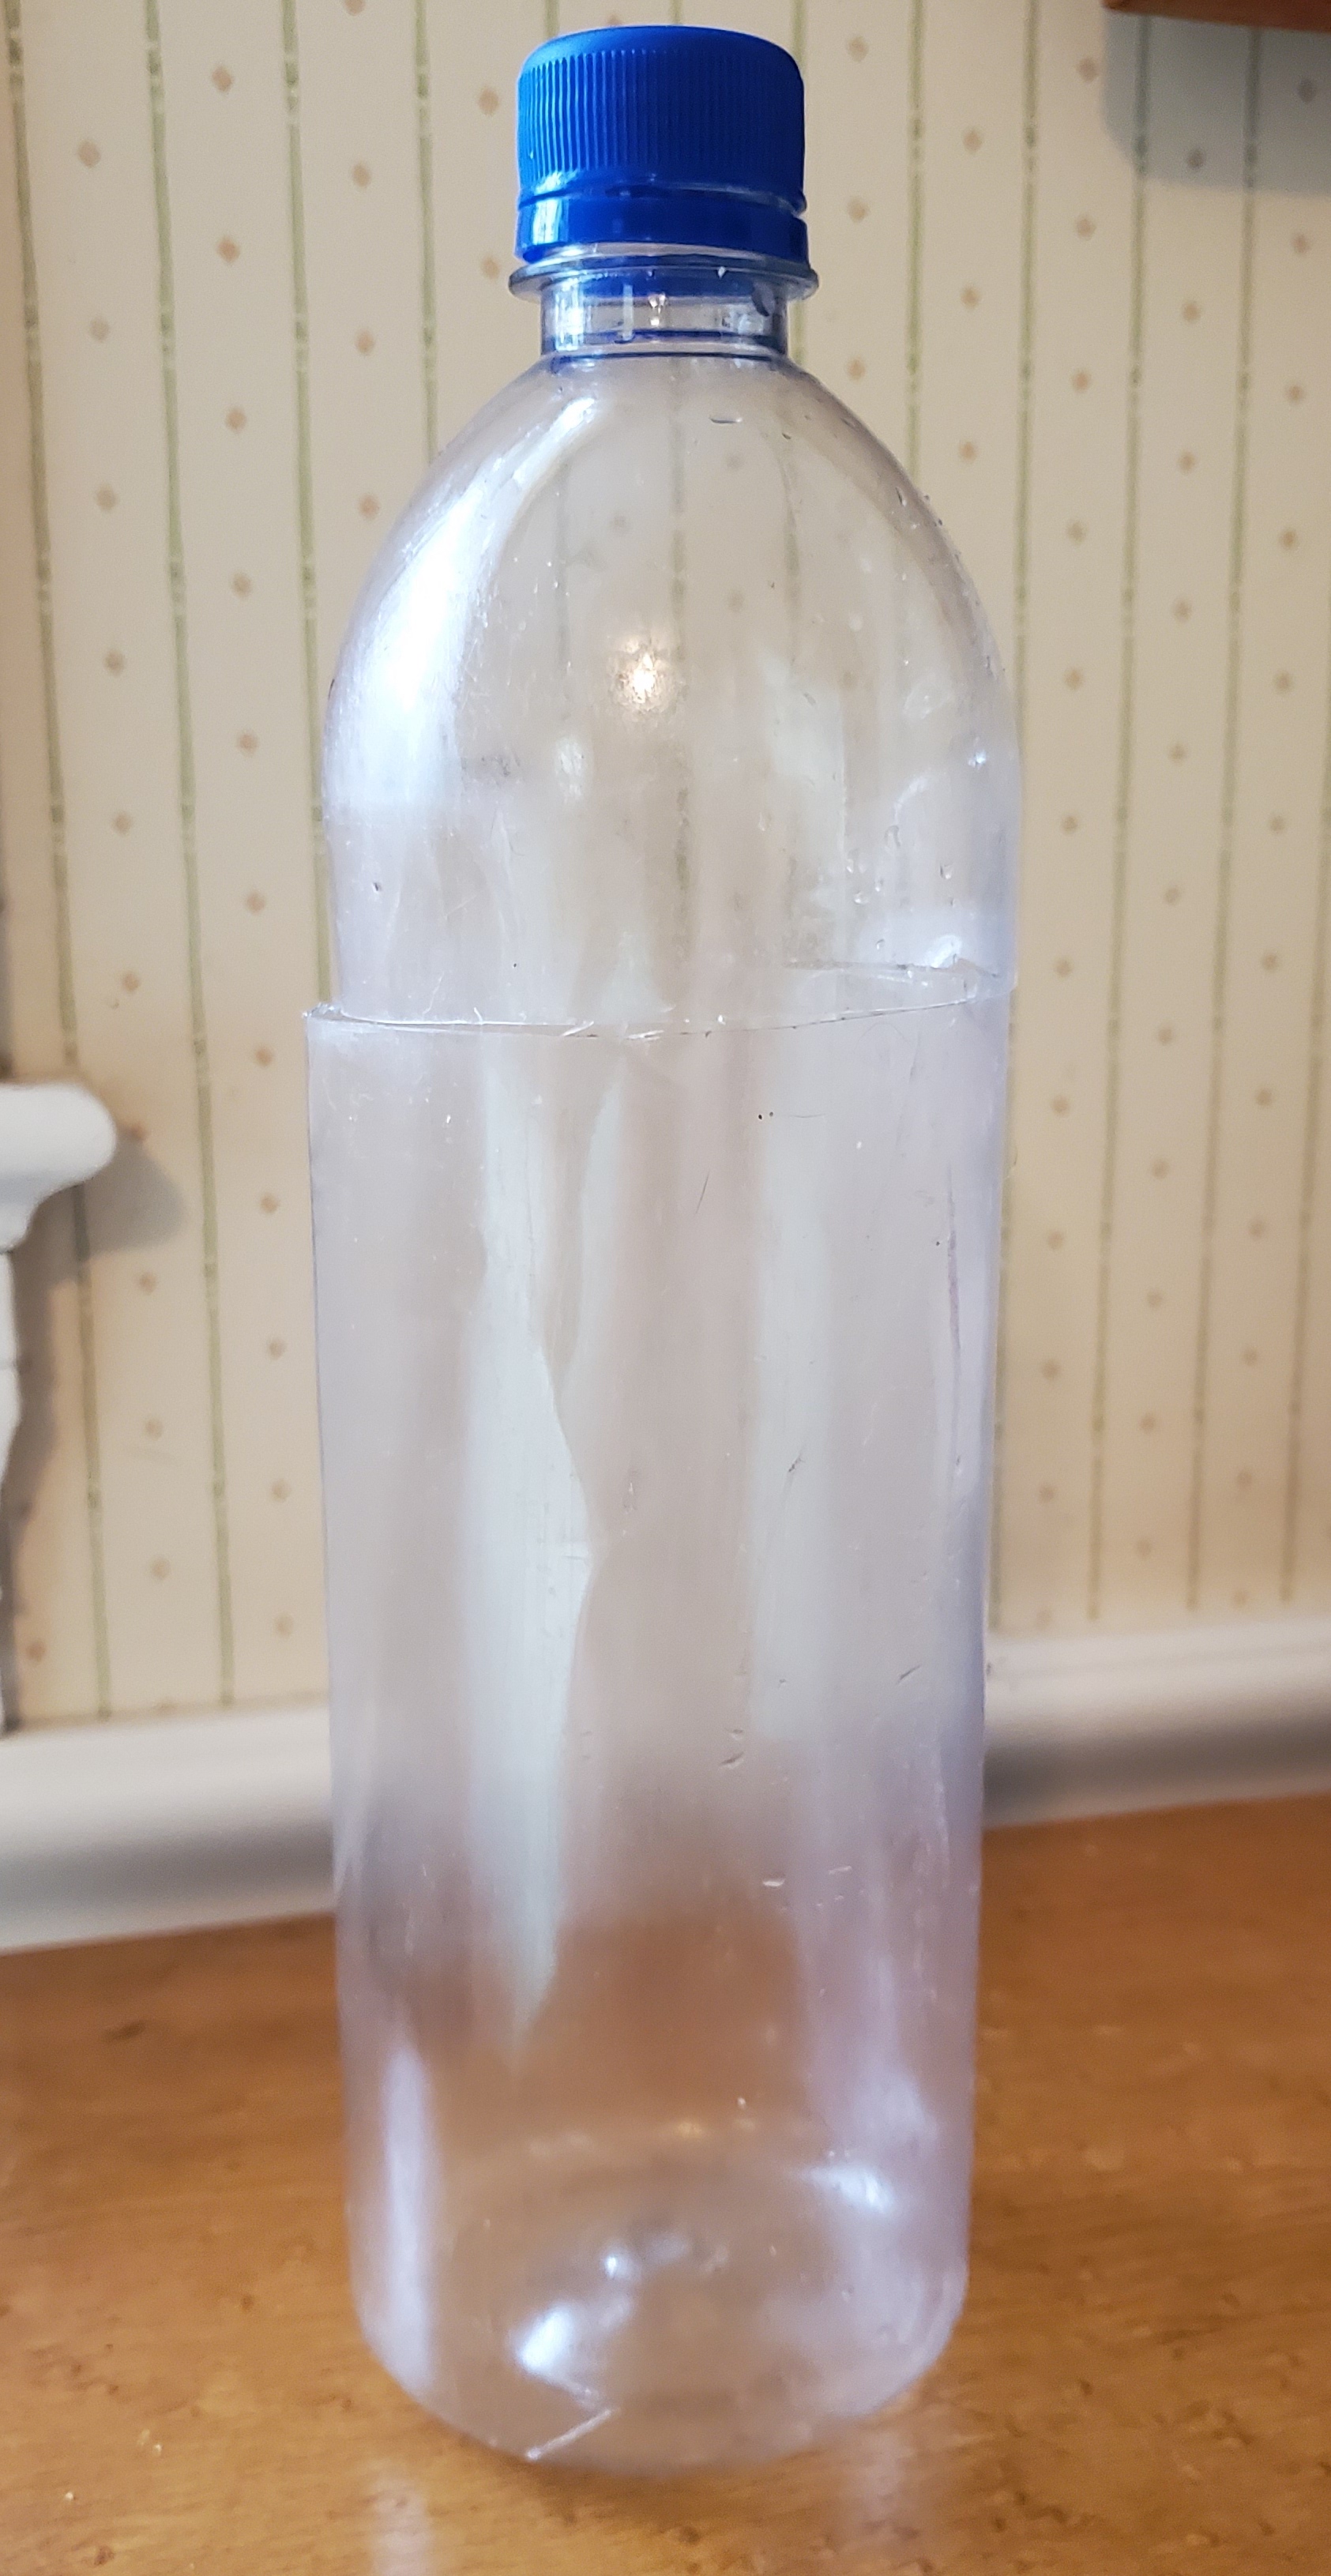
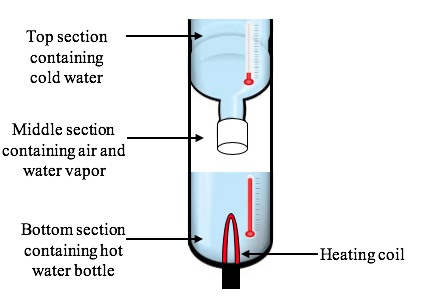
As a science project, a girl builds a device to create water droplets. The device is made of a water bottle that has been cut into two sections. She takes the top section of the bottle and flips it over so that it sits inside the bottom section as shown below.
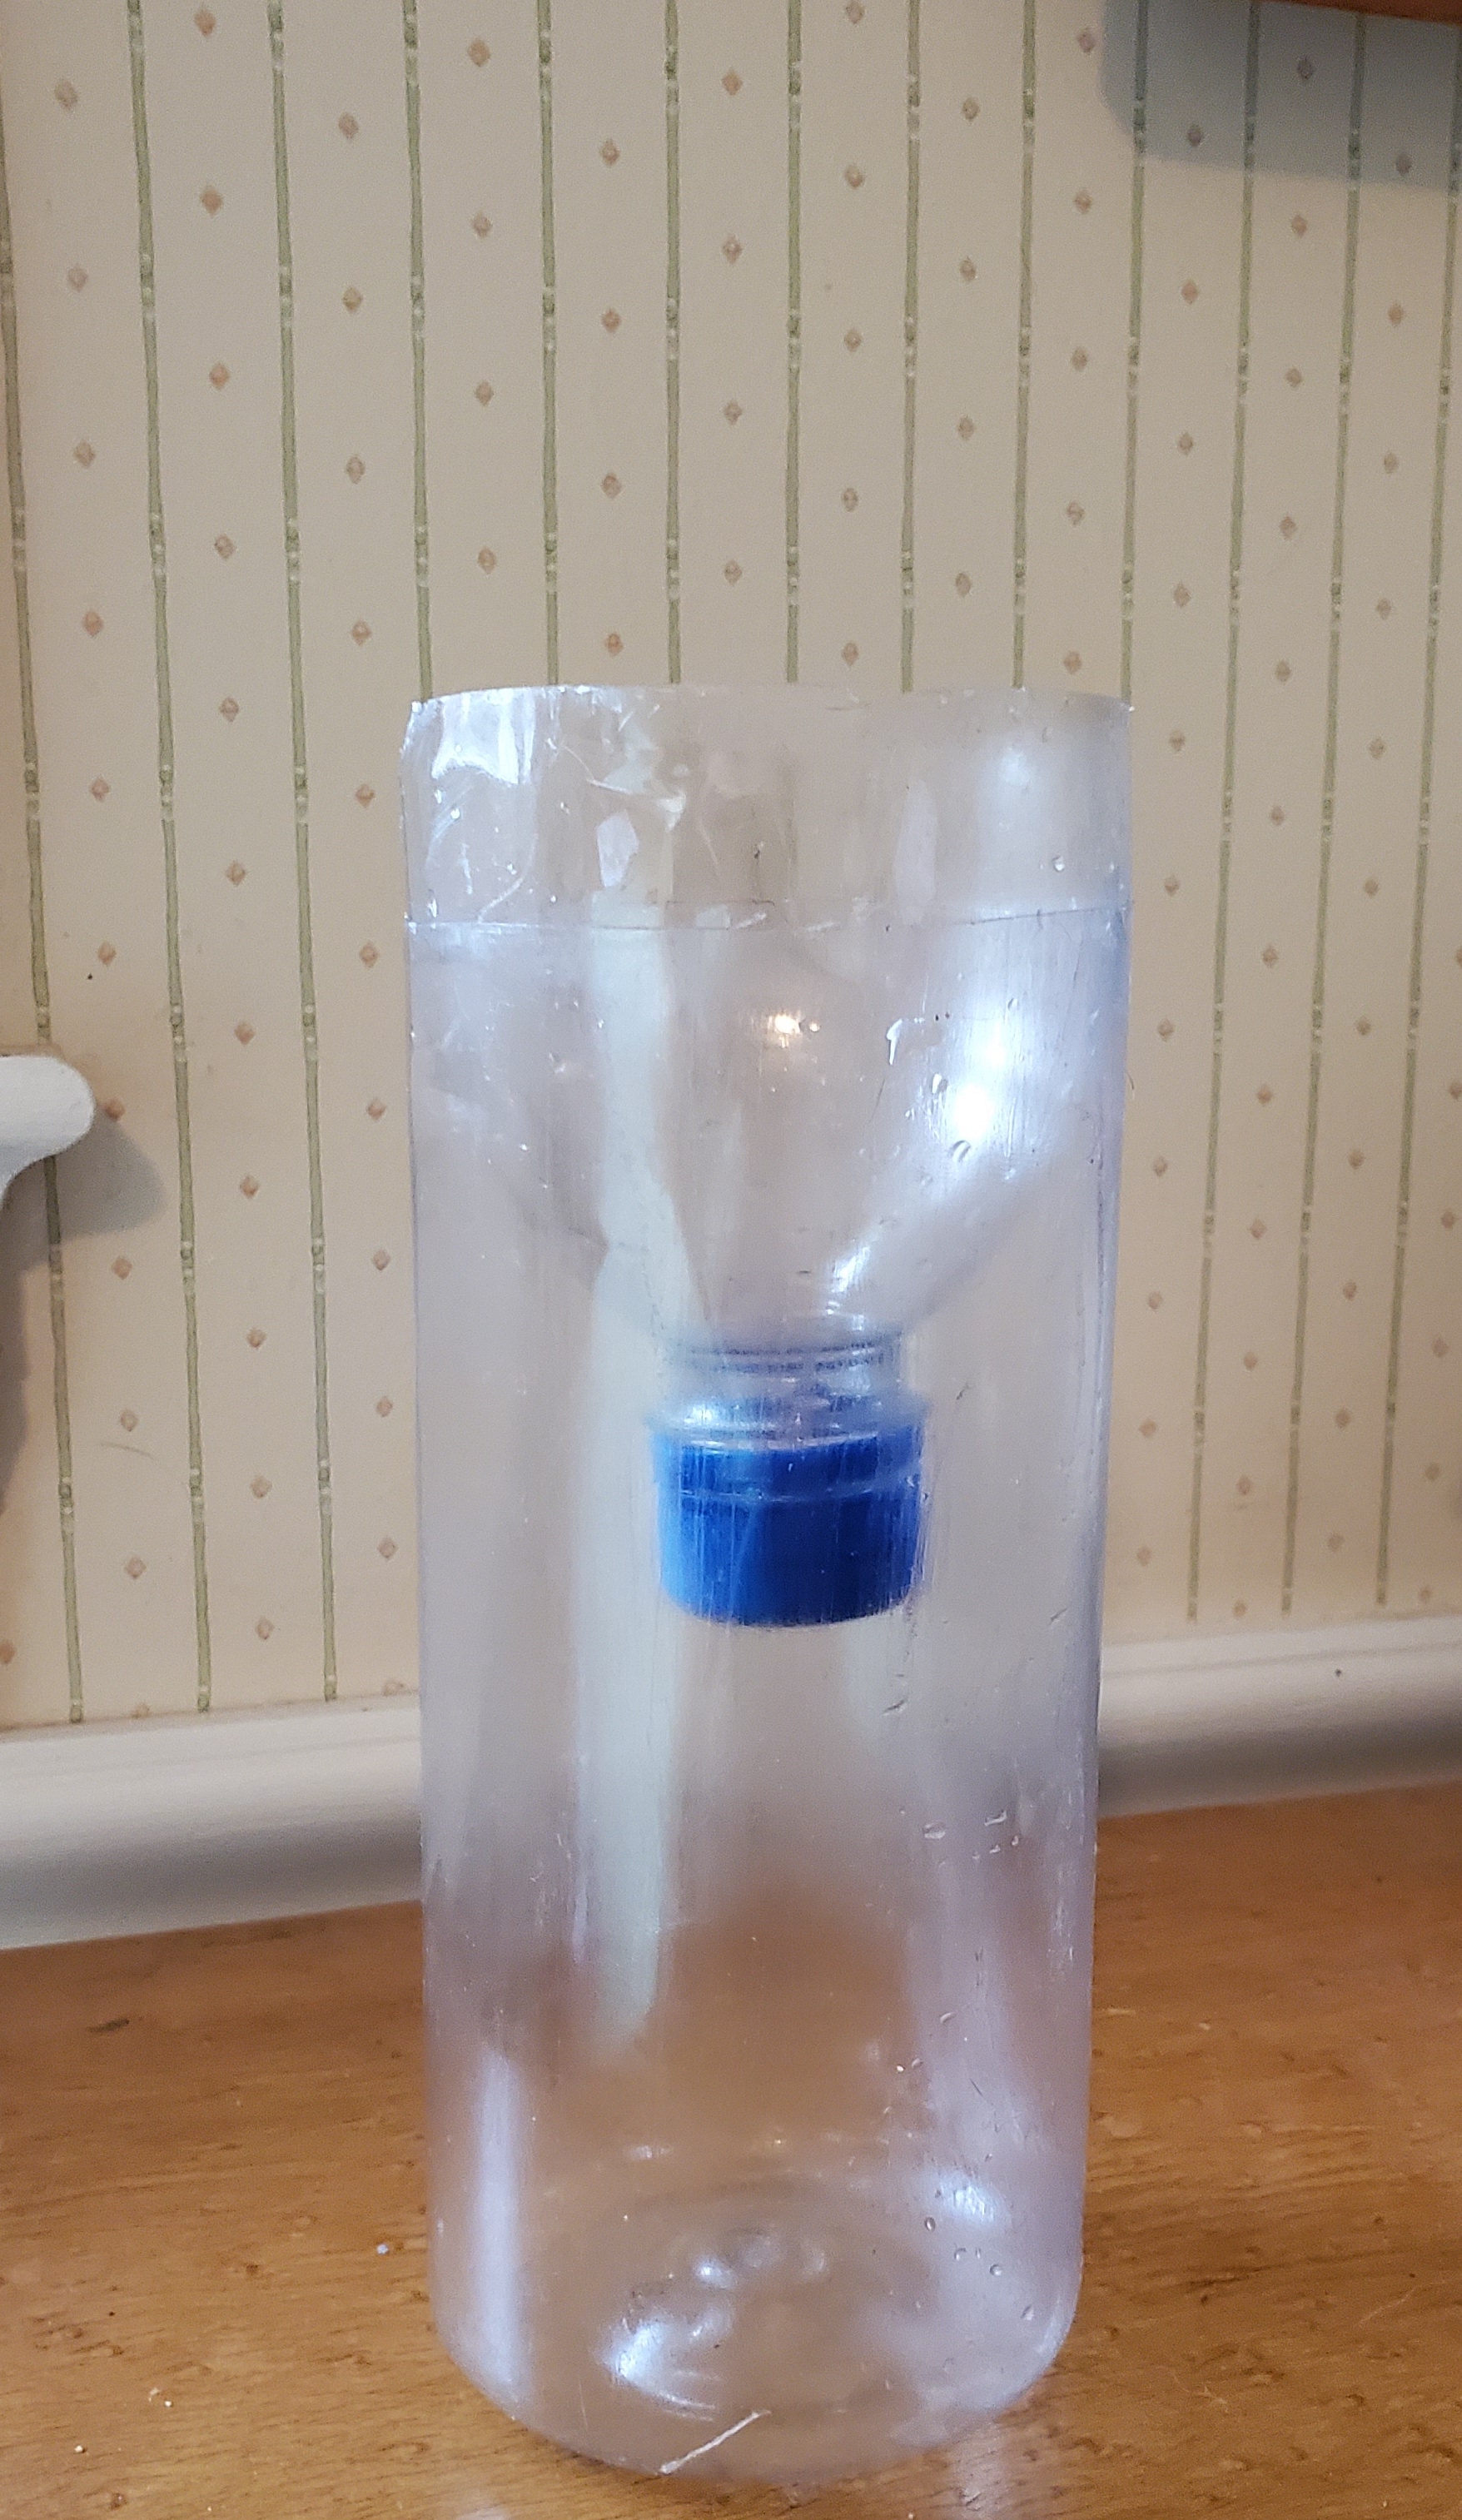
She places water at 0 °C in the top section and an equal amount of water at 100 °C in the bottom section. After placing the hot water in the bottom section, she leaves a space between the top and bottom sections. That middle section is empty except for air and water vapor. A diagram of the girl’s device is shown below.
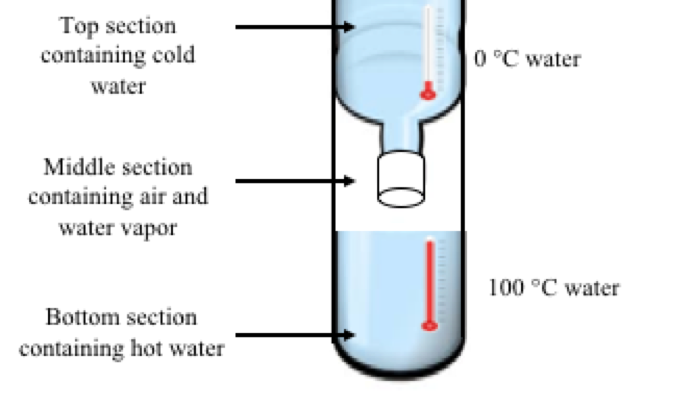
After a few minutes, water droplets form on the outside surface of the top section.
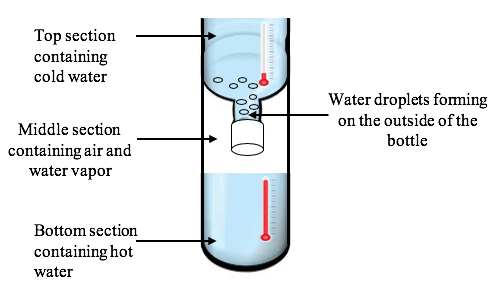
The girl notices that water droplets stop forming after an hour and eventually all the water droplets disappear.
The girl thinks that this is due to changes in the temperature of the water in each section of the device. She refills the device with water at 0 °C and 100 °C, but this time she records the temperature of the water in each section every five minutes. Below is a plot of her data.
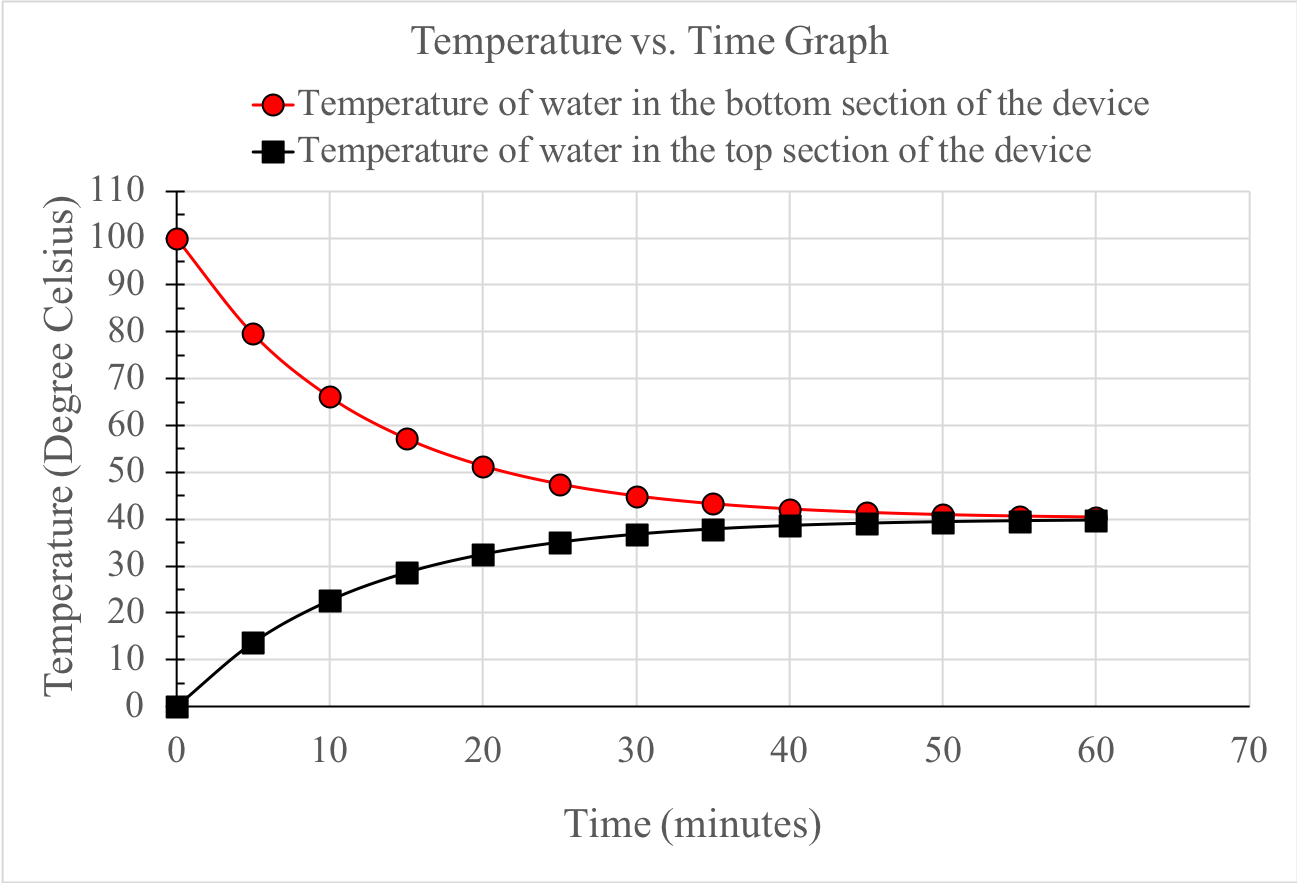
1. Describe the patterns you observe in the data for the temperature of water in the top and bottom sections of the device.
A. Over time the temperature in the top section increased while the temperature in the bottom section increased.
B. Over time the temperature in the top section increased while the temperature in the bottom section decreased.
C. Over time the temperature in the top section decreased while the temperature in the bottom section decreased.
D. Over time the temperature in the top section decreased while the temperature in the bottom section increased.
2. Which of the following best describes how energy was transferred during the experiment?
A. Energy was transferred from the hotter water in the bottom section to the colder water in the top section until the energy was distributed evenly between the water in the top and bottom sections.
B. Energy was transferred from the hotter water in the bottom section to the colder water in the top section, but the energy never became evenly distributed between the water in the top and bottom sections.
C. Energy was transferred from the colder water in the top section to the hotter water in the bottom section until the energy was distributed evenly between the water in the top and bottom sections.
D. Energy was transferred from the colder water in the top section to the hotter water in the bottom section, but the energy never became evenly distributed between the water in the top and bottom sections.
The girl wants her device to continue to produce water droplets. So, she decides to add a heating coil that will heat the water in the bottom section of the device to keep its temperature at 100 °C.
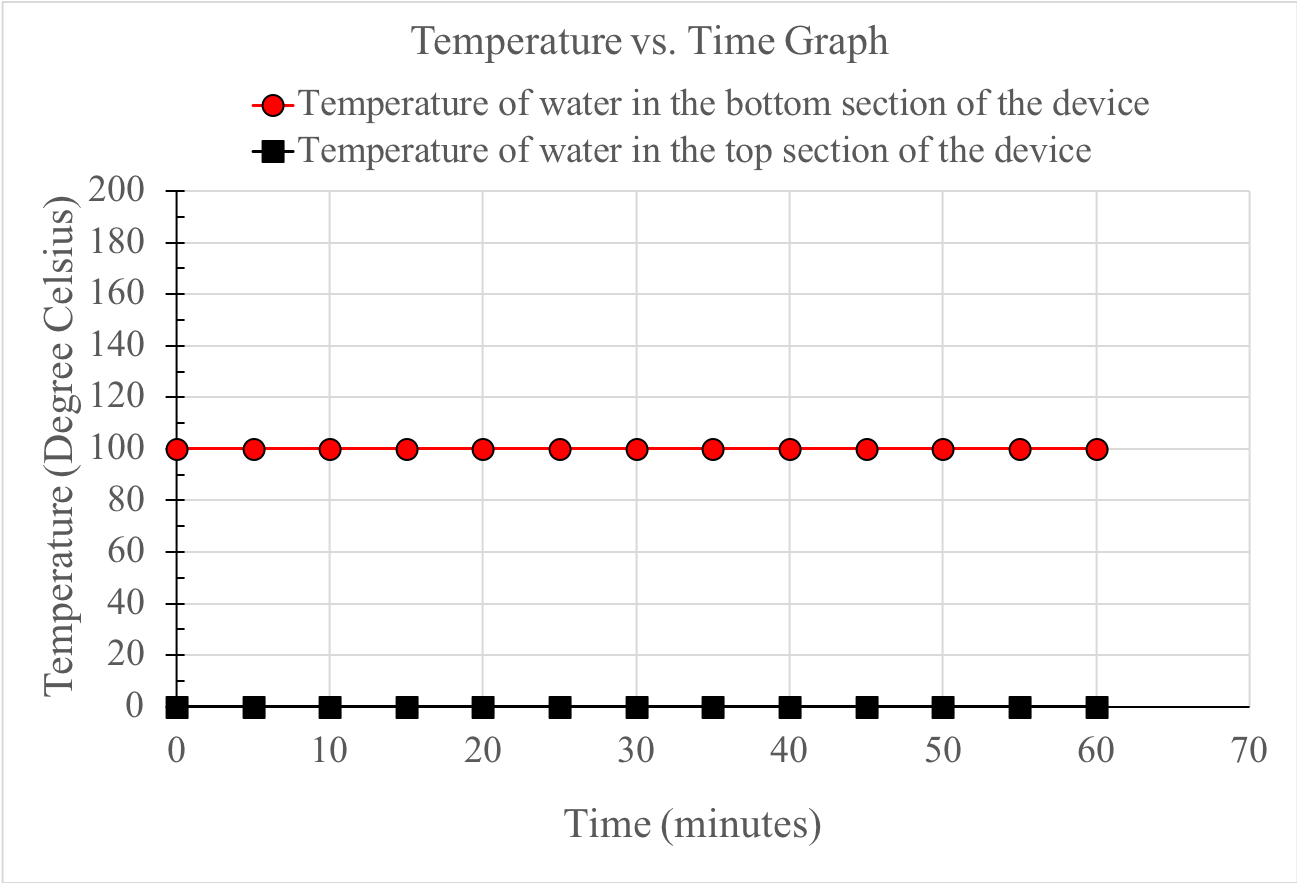
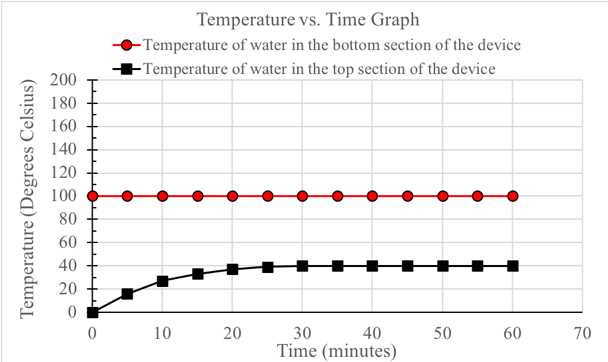
3. Which of the following graphs best represents how you think the temperature of the water in the top section of the device will change if the temperature of the water in the bottom section is kept at 100 °C?
| A. |
|
| B. |
|
| C. |
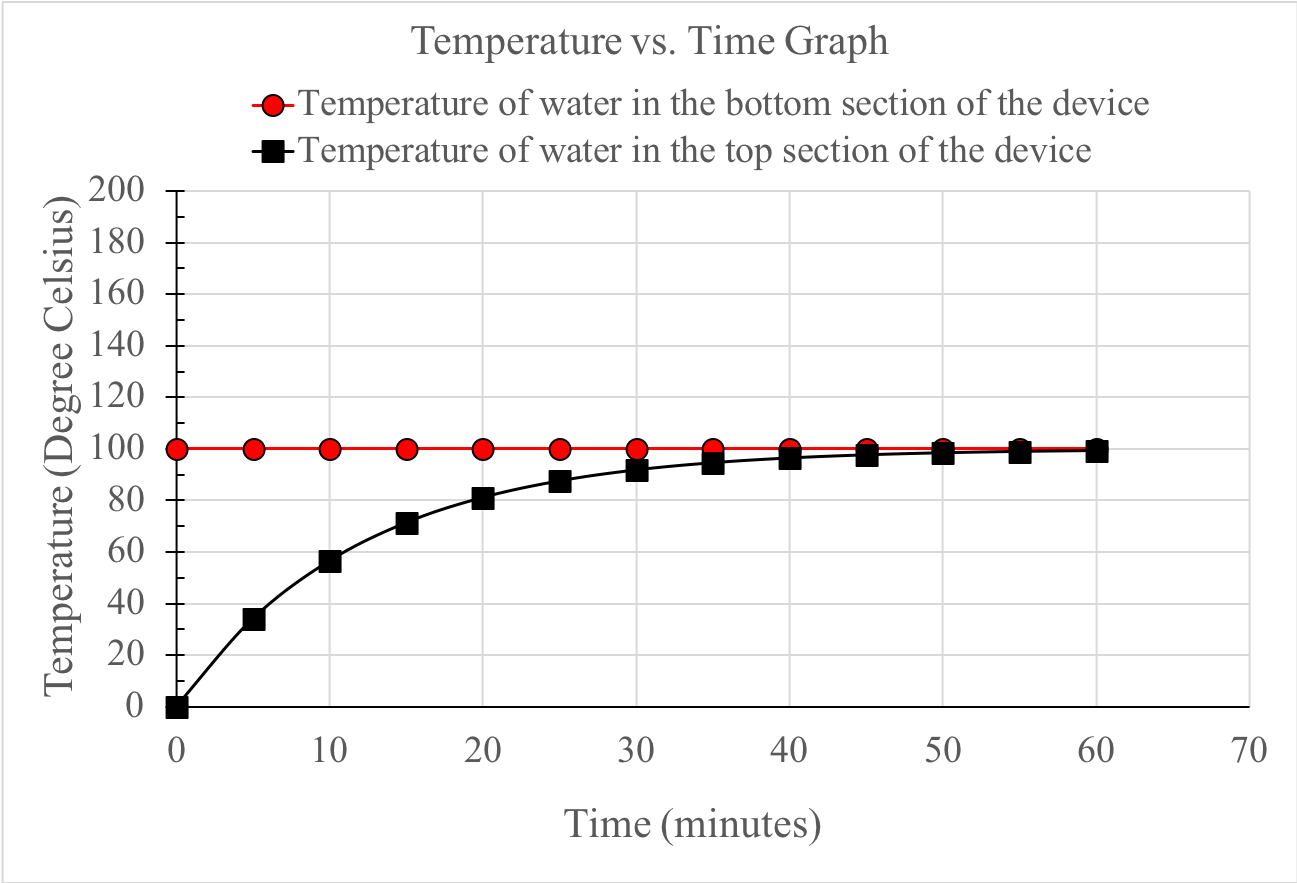
|
| D. |
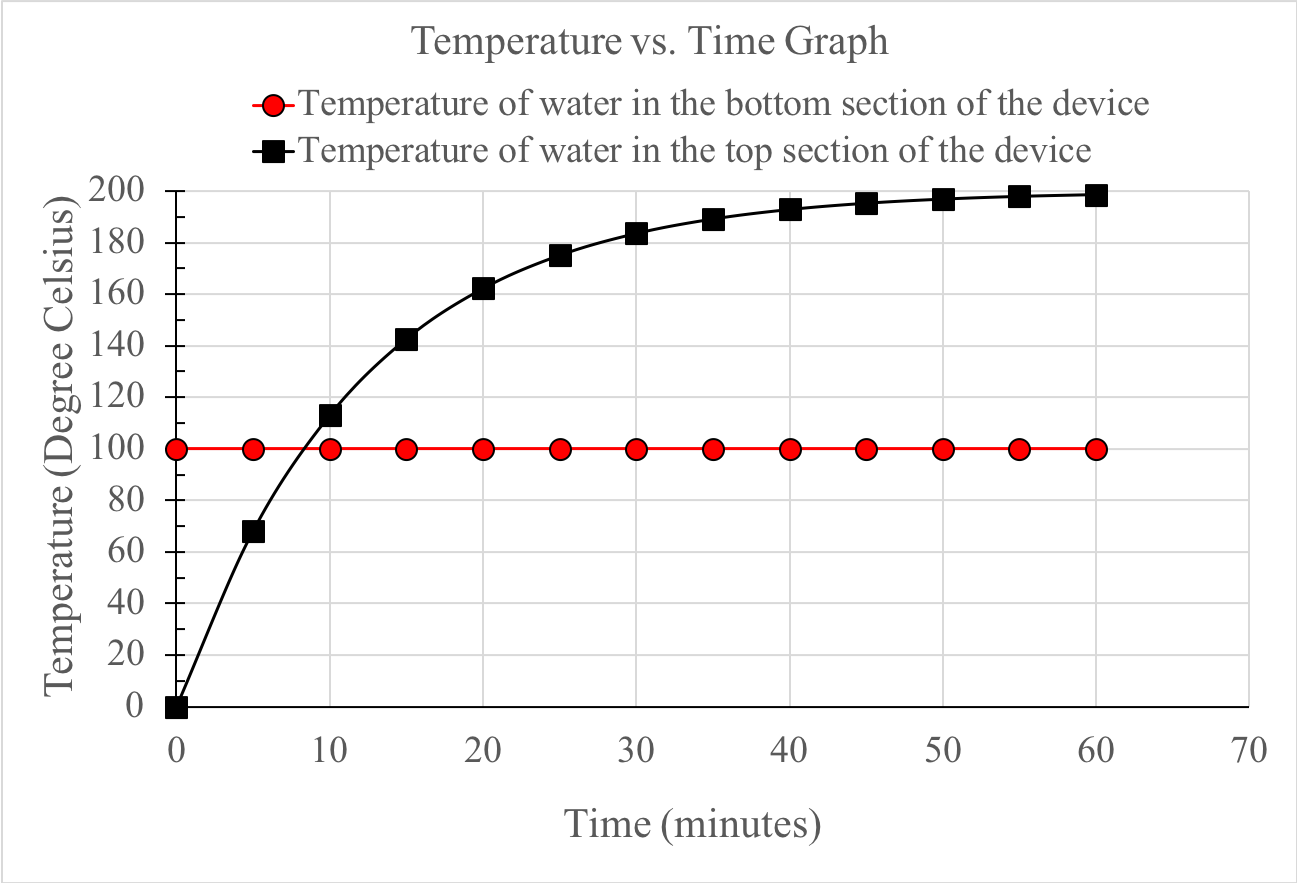
|
4. The girl believes that keeping the water in the bottom part of the device at 100 °C will cause the device to continue to produce water droplets in the middle section.
Write an argument for or against the idea that the device will continue to produce water droplets as long as the heater is on and the the water in the bottom part is kept at 100 °C. Support your argument using the graph you selected, evidence from the girl’s previous experiments, and what you know about energy transfer. Clearly state any assumptions you are making in your argument.
- Percent of Points Earned

- Points Earned
| Avg. Earned | Possible | Percent | |
|---|---|---|---|
- Overall Task Difficulty
| Total Points Earned | Total Points Possible | Total Percent | |
|---|---|---|---|
| NAN | NAN | NAN% |
n =
Note: The total percent is a weighted average based on the total number of points earned divided by the total number of points possible.
- Science and Engineering Practices
- SEP4 Construct, analyze, and/or interpret graphical displays of data and/or large data sets to identify linear and nonlinear relationships.
SEP7 Construct, use, and/or present an oral and written argument or counter-arguments based on data and evidence.
SEP8 Communicate scientific and/or technical information or ideas (e.g. about phenomena and/or the process of development and the design and performance of a proposed process or system) in multiple formats (i.e., orally, graphically, textually, mathematically). - Crosscutting Concepts
- CC1 Graphs, charts, and images can be used to identify patterns in data.
- Disciplinary Core Ideas
- PS3.B Uncontrolled systems always evolve toward more stable states--that is, toward more uniform energy distribution (e.g., water flows downhill, objects hotter than their surrounding environment cool down).

