ASPECt 3D
![]() 3D Energy Tasks
3D Energy Tasks
![]() Chemical processes and whether or not energy is stored or released can be understood in terms of the rearrangeme…
Chemical processes and whether or not energy is stored or released can be understood in terms of the rearrangeme…
Item AP034006: Explain the changes in carbon dioxide uptake of a tree observed during a solar eclipse using a model of atom rearrangement during photosynthesis.

A solar eclipse occurs when the moon moves in front of the sun to block sunlight from reaching the Earth. Scientists have noticed that during a solar eclipse there is a decrease in the amount of carbon dioxide (CO2) that trees take in.
A graph of the amount of carbon dioxide that was taken in during a solar eclipse is shown below. The eclipse lasted from approximately 9:00 AM to 12:00 PM, with the sunlight being completely blocked at 11:00 AM.
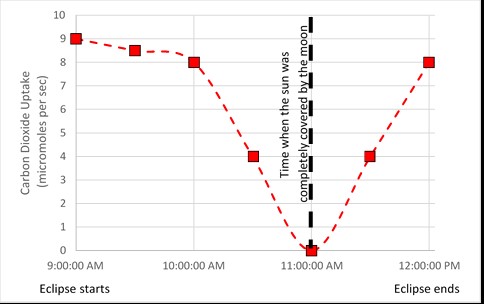
1. Describe how the amount of carbon dioxide that was taken in by the leaves of the trees changed from the start of the eclipse (9:00 AM) to the end of the eclipse (12:00 PM).
The scientists also measured the amount of energy that was transferred to the leaves of the trees by sunlight during this time.
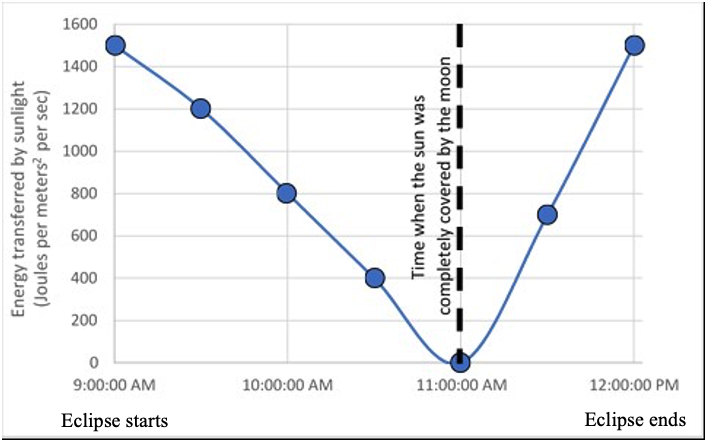
2. Describe how the amount of energy that was transferred to the trees by sunlight changed from the start of the eclipse (9:00 AM) to the end of the eclipse (12:00 PM).
3. Using the data from both graphs, which of the following best describes the relationship between the amount of carbon dioxide that was taken in by the trees and the amount of energy that was transferred to the trees by sunlight during the eclipse?
A. The amount of carbon dioxide that was taken in by the trees increased as the amount of energy transferred to the trees increased.
B. The amount of carbon dioxide that was taken in by the trees increased as the amount of energy transferred to the trees decreased.
C. The amount of carbon dioxide that was taken in by the trees increased as the amount of energy transferred to the trees stayed the same.
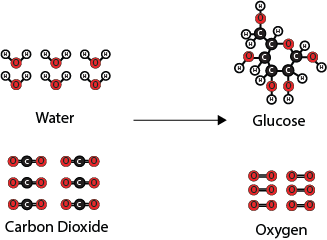
The scientists want to explain the changes in carbon dioxide uptake they observed during the solar eclipse. They know that the carbon dioxide that was taken in by the leaves of trees reacts with water to form glucose and oxygen. Below is a molecular model showing this reaction.
The potential energy of this chemical reaction system changes during the reaction as the configuration of atoms and molecules changes. Below is a model showing the potential energy associated with the initial, intermediate, and final configurations of the atoms and molecules in the system. The intermediate configuration represents when bonds are breaking and forming and the potential energy is the highest.
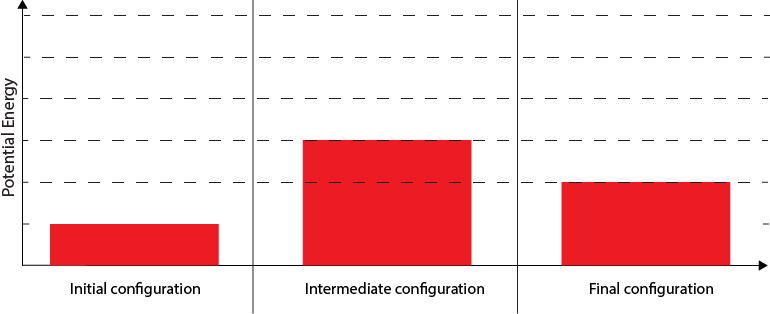
4. How is the amount of energy that was transferred to the tree by sunlight represented in the model?
A. The height of the bar for the initial configuration
B. The height of the bar for the intermediate configuration
C. The height of the bar for the final configuration
D. The difference in the heights of the bars for the initial and final configurations
E. The difference in the heights of the bars for the initial and intermediate configurations
F. The difference in the heights of the bars for the intermediate and final configurations
5. Does the model show that a net amount of energy was taken in or released during the chemical reaction?
A. Taken in
B. Released
C. Neither taken in nor released
6. Explain how changes in the amount of energy that was transferred to the trees during the eclipse caused the amount of carbon dioxide that was taken in by the trees to change. You should support your explanation using:
- the scientists' potential energy model
- what you know about the energy associated with breaking and making bonds
- Percent of Points Earned

- Points Earned
| Avg. Earned | Possible | Percent | |
|---|---|---|---|
| Q1 | 0.43 | 1 | 43% |
| Q2 | 0.36 | 1 | 36% |
| Q3 | 0.42 | 1 | 42% |
| Q4 | 0.15 | 1 | 15% |
| Q5 | 0.42 | 1 | 42% |
| Q6 | 0.22 | 3 | 7% |
- Overall Task Difficulty
| Total Points Earned | Total Points Possible | Total Percent | |
|---|---|---|---|
| 1.99 | 8 | 25% |
n = 207
Note: The total percent is a weighted average based on the total number of points earned divided by the total number of points possible.
- Science and Engineering Practices
- SEP2 Use a model to predict the relationships between systems or between components of a system.
SEP4 Construct, analyze, and/or interpret graphical displays of data and/or large data sets to identify linear and nonlinear relationships.
SEP6 Construct and revise an explanation based on valid and reliable evidence obtained from a variety of sources (including students' own investigations, models, theories, simulations, peer review) and the assumption that theories and laws that describe the natural world operate today as they did in the past and will continue to do so in the future - Crosscutting Concepts
- CC1 Graphs, charts, and images can be used to identify patterns in data.
CC2 Empirical evidence is required to differentiate between cause and correlation and make claims about specific causes and effects.
CC2 Cause and effect relationships can be suggested and predicted for complex natural and human designed systems by examining what is known about smaller scale mechanisms within the system. - Disciplinary Core Ideas
- PS1.A A stable molecule has less energy than the same set of atoms separated; one must provide at least this energy in order to take the molecule apart.
PS1.B Chemical processes, their rates, and whether or not energy is stored or released can be understood in terms of the collisions of molecules and the rearrangements of atoms into new molecules, with consequent changes in the sum of all bond energies in the set of molecules that are matched by changes in kinetic energy.
LS1.C As a result of these chemical reactions, energy is transferred from one system of interacting molecules to another. Cellular respiration is a chemical process in which the bonds of food molecules and oxygen molecules are broken and new compounds are formed that can transport energy to muscles. Cellular respiration also releases the energy needed to maintain body temperature despite ongoing energy transfer to the surrounding environment.