Item AP014006: Analyze data and graphical displays to gather evidence that can be used to explain why a tennis ball bounces to a lower height when bounced alone and a much higher height when bounced on top of a basketball. (MC version)
An athlete has a tennis ball and a basketball. She stacks the tennis ball on top of the basketball and drops them together. Watch the video of what happens:
The results surprise the athlete. She decides to bounce each ball separately and observe how high the balls bounce compared to when the balls are stacked. Watch the video below to see what happens when the balls are dropped separately:
The athlete drops the tennis ball and the basketball separately multiple times using different initial heights. She records the final height of the ball each trial. She then plots bar graphs and looks for patterns in the data.
| Ball | Trial | Initial height before being dropped (meters) | Final height after bouncing once (meters) |
| Tennis ball | 1 | 0.500 | 0.187 |
| 2 | 1.000 | 0.383 | |
| 3 | 1.500 | 0.493 | |
| Basketball | 1 | 0.500 | 0.370 |
| 2 | 1.000 | 0.693 | |
| 3 | 1.500 | 1.005 | |
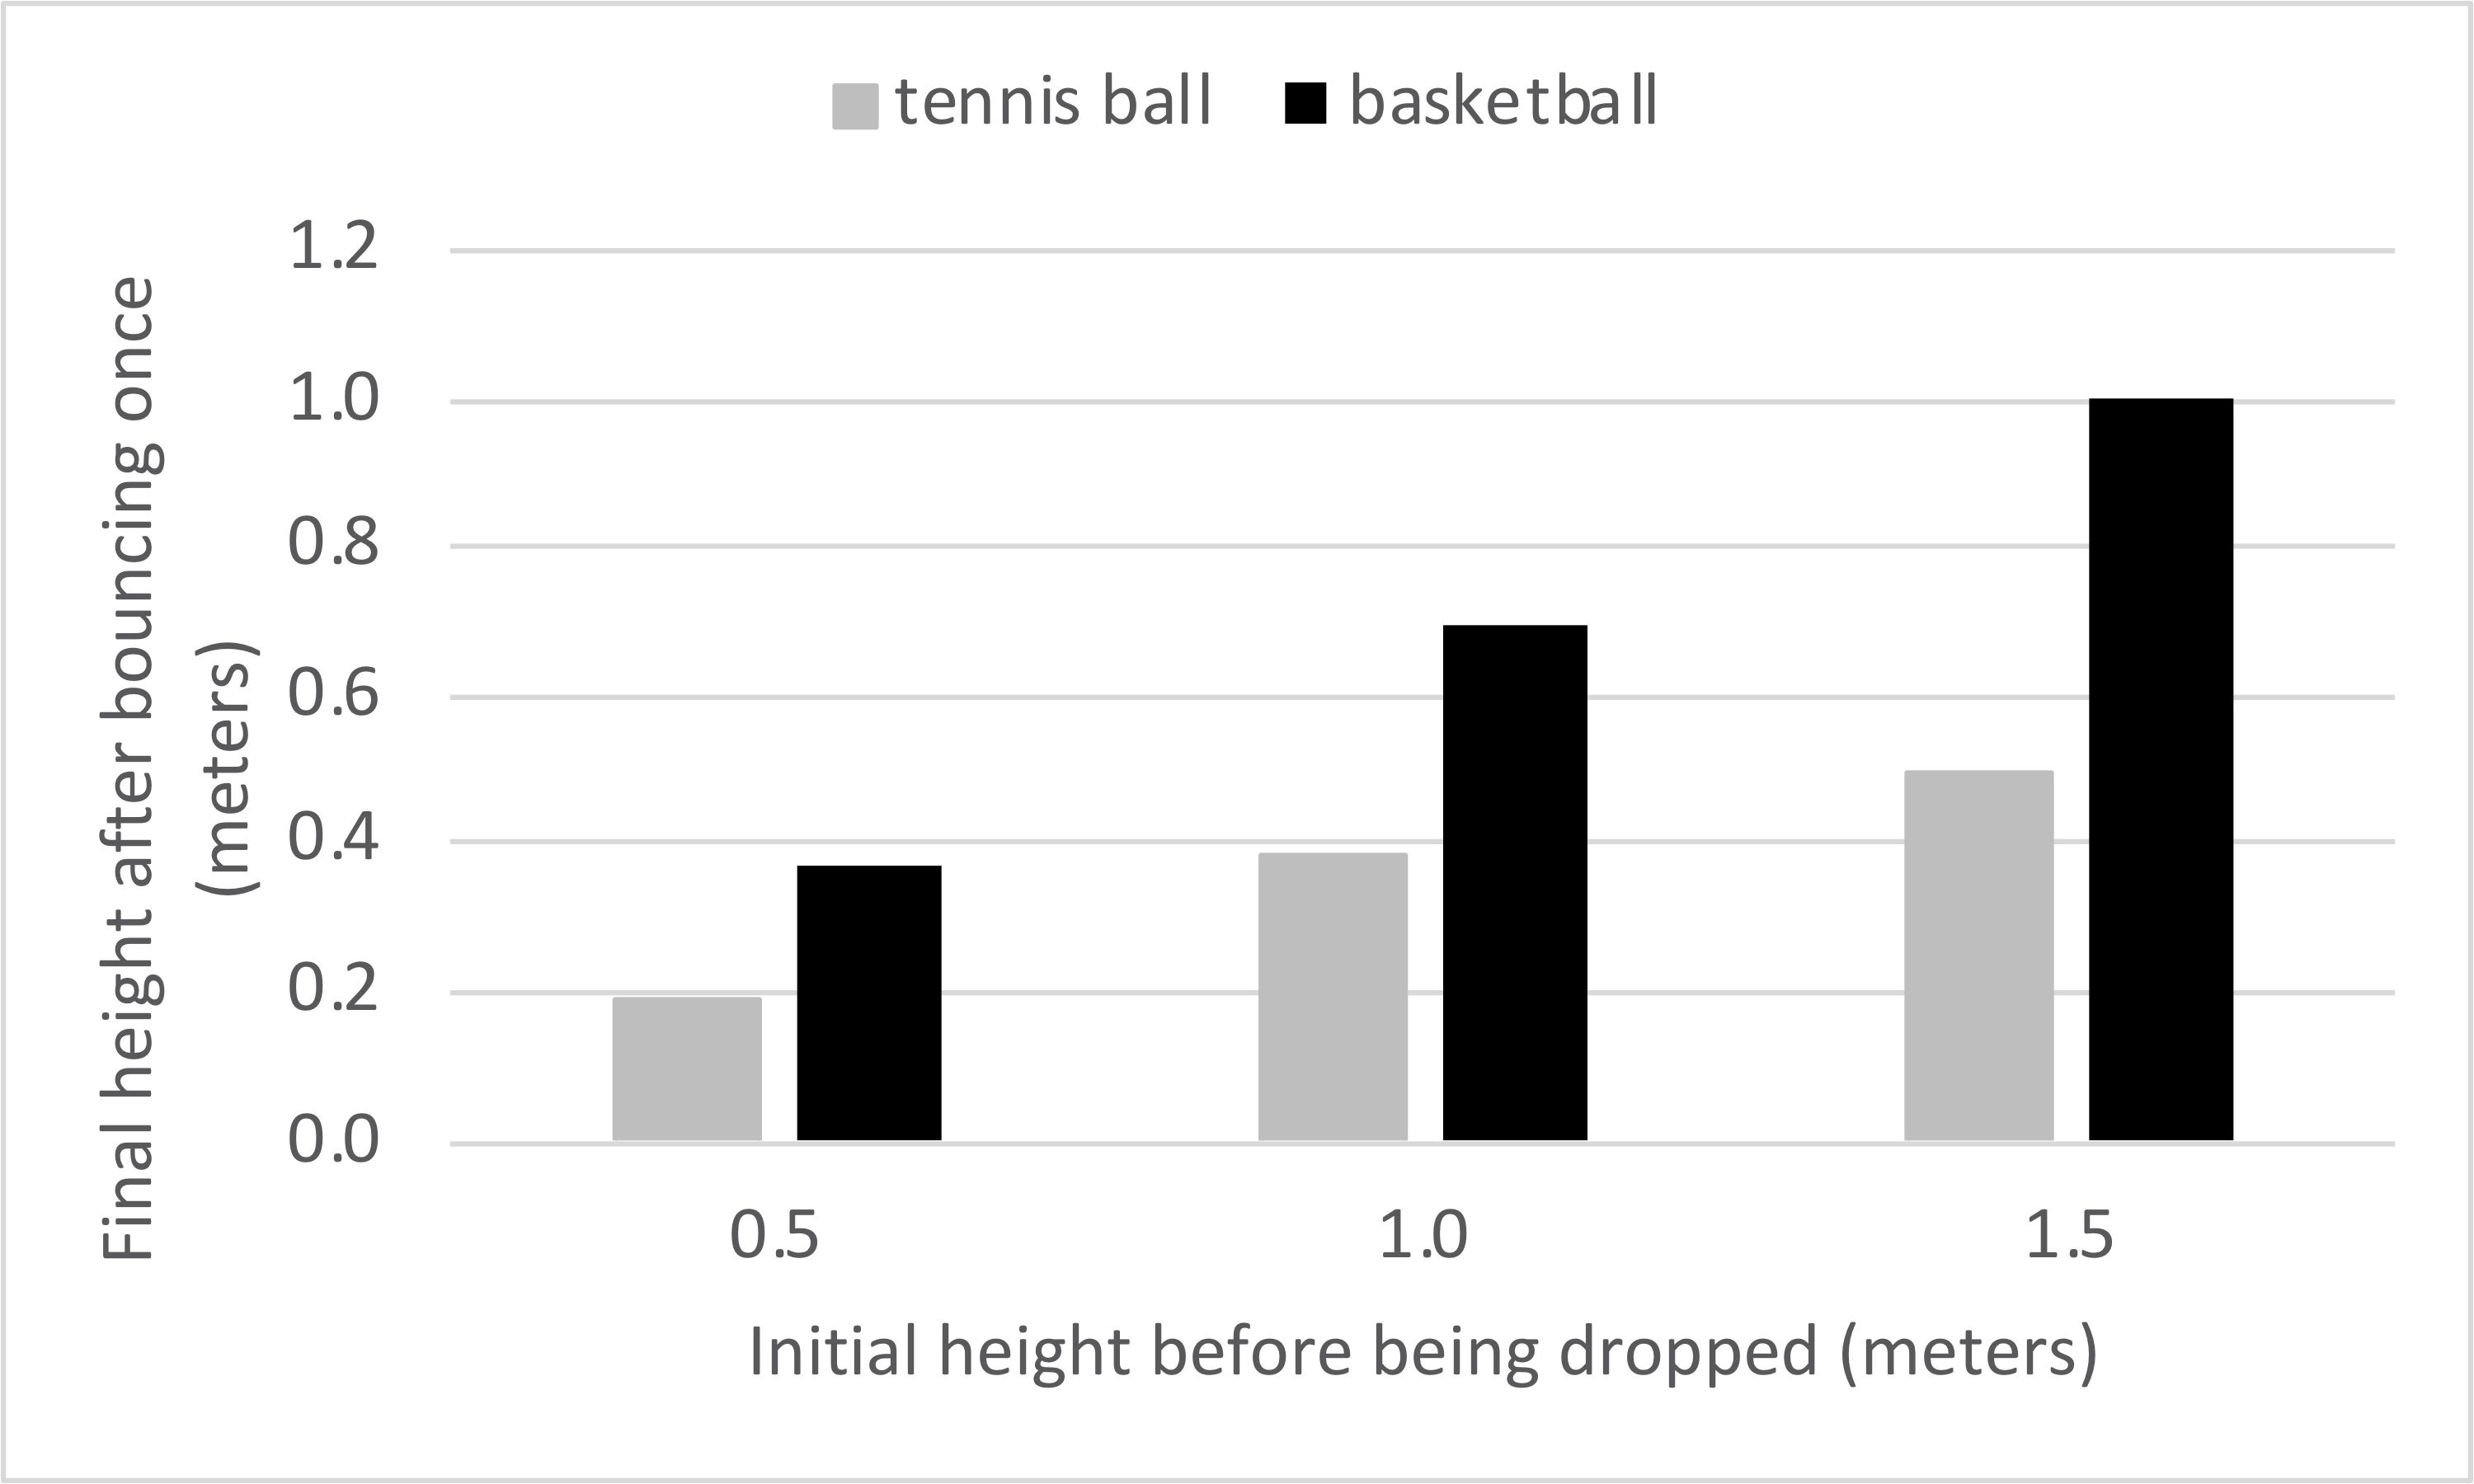
1. For each trial, compare the final height of the tennis ball to the final height of the basketball after each has bounced to its maximum height. What pattern do you observe?
A. The basketball bounces lower than the tennis ball in each trial.
B. The basketball bounces higher than the tennis ball in each trial.
C. The basketball bounces the same amount as the tennis ball in each trial.
D. There is no pattern.
2. For each trial, compare the difference in the initial height of the tennis ball and the final height of the tennis ball after bouncing. What pattern do you observe?
A. The final height of the tennis ball is lower than its initial height
B. The final height of the tennis ball is higher than its initial height.
C. The final height of the tennis ball is the same as its initial height.
D. There is no pattern.
The diagram below shows just the tennis ball at four time points during the bounce. Time 1 is the initial height of the ball before being dropped. Time 4 is the final height the ball reaches after bouncing once.
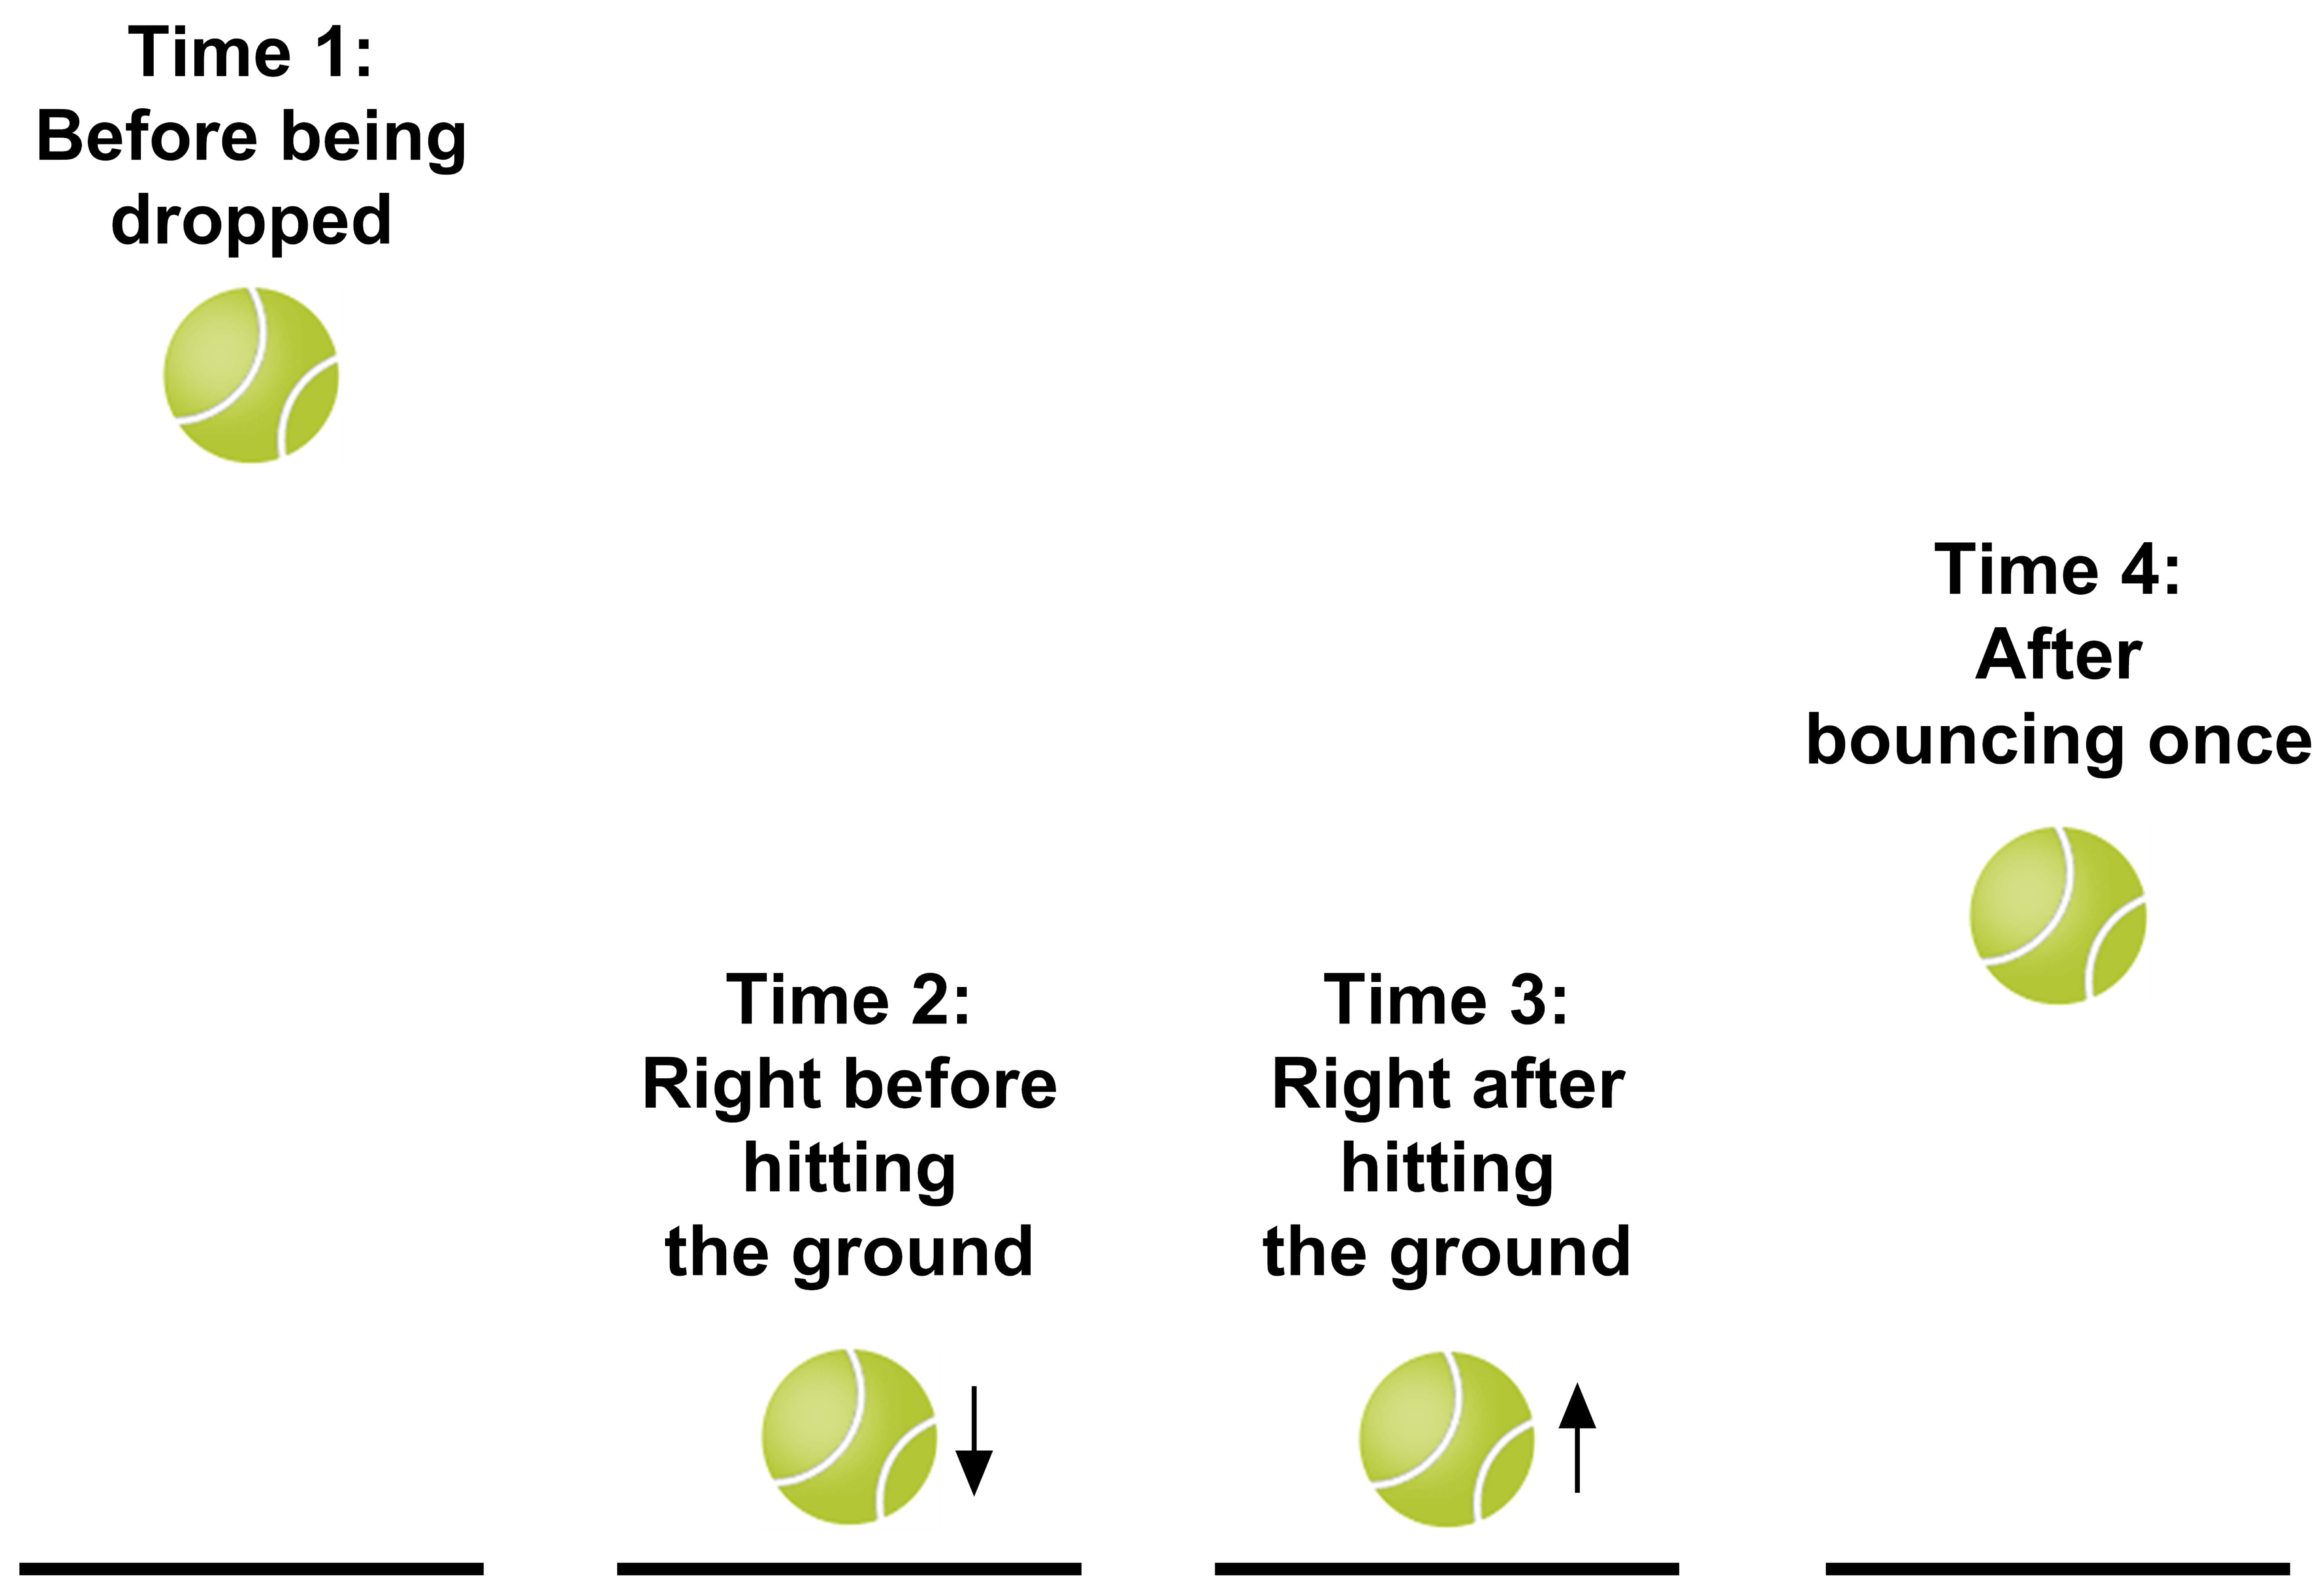
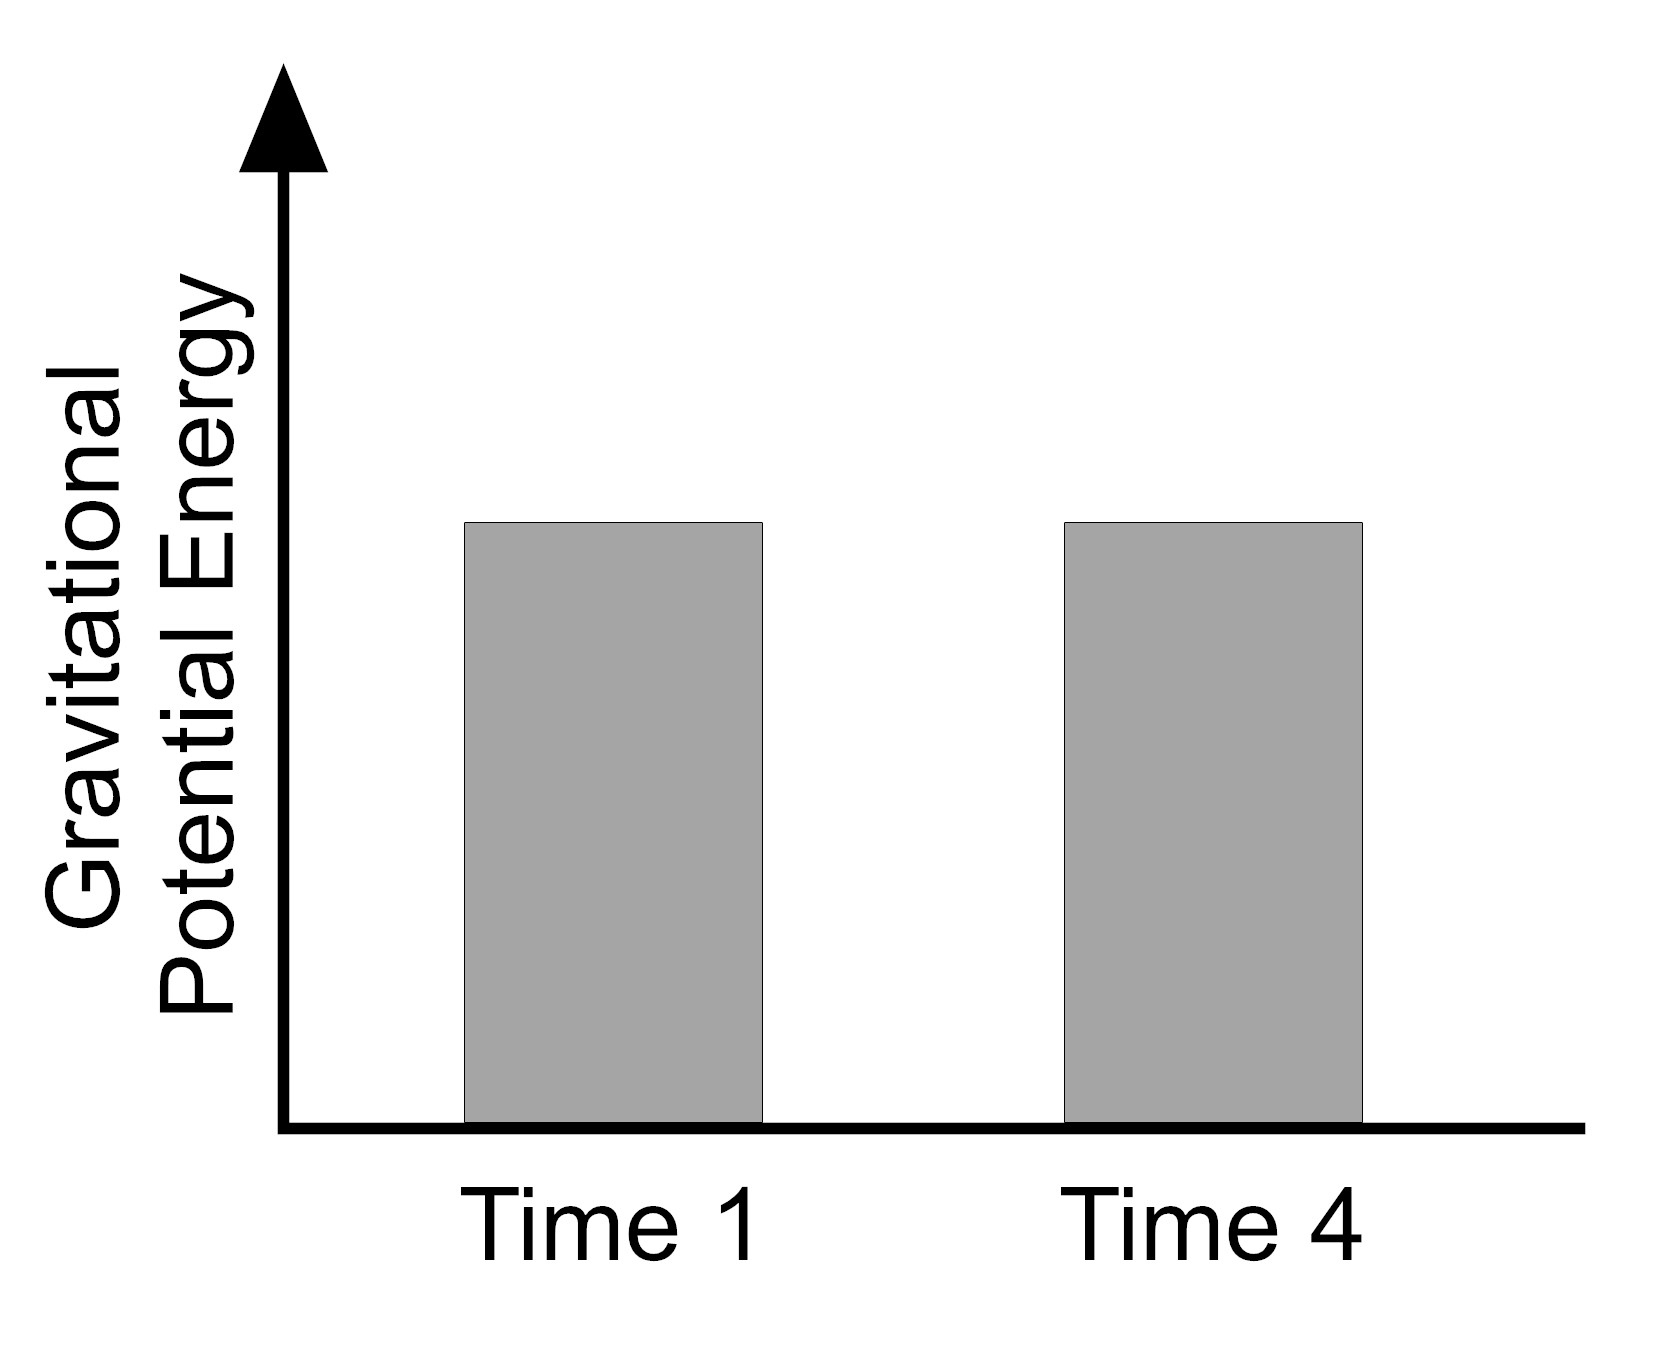
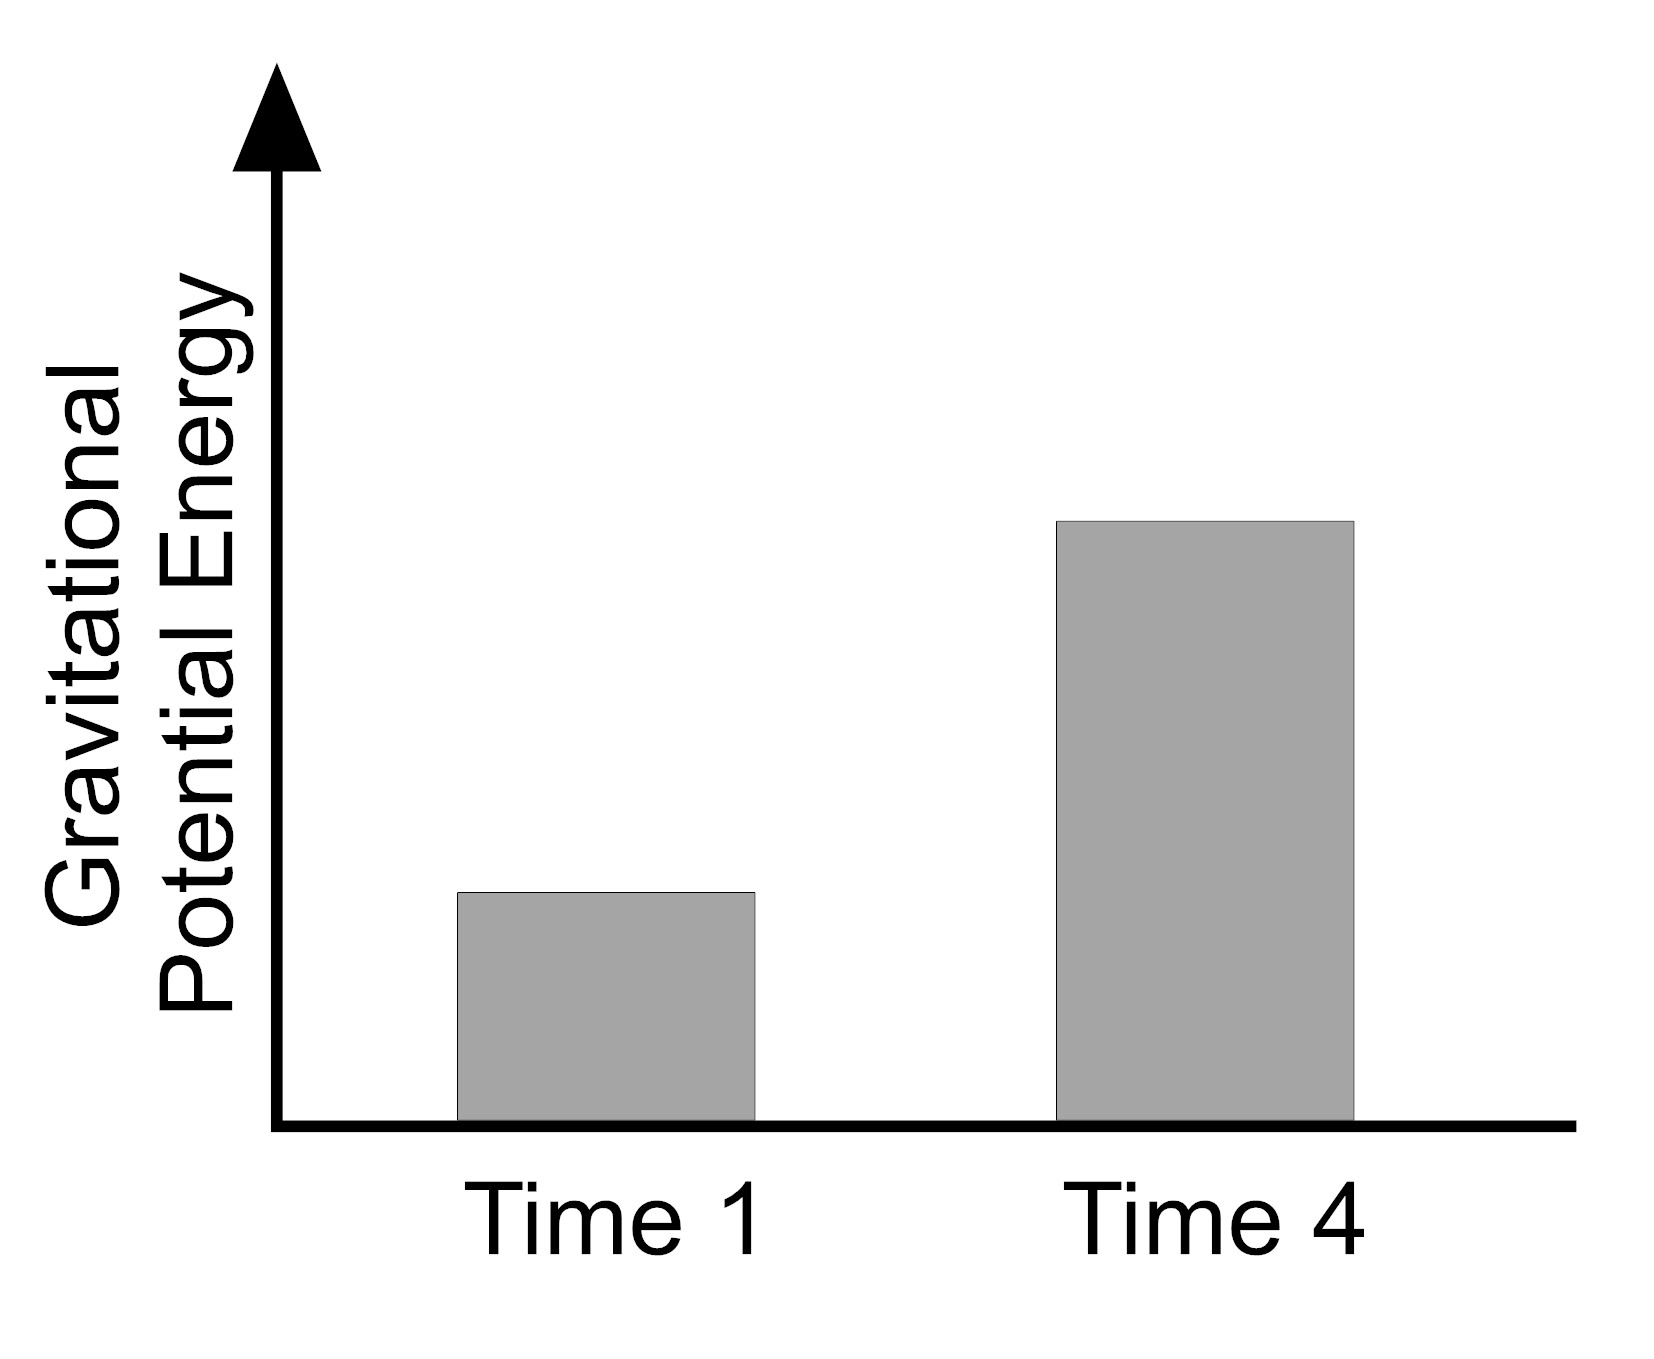
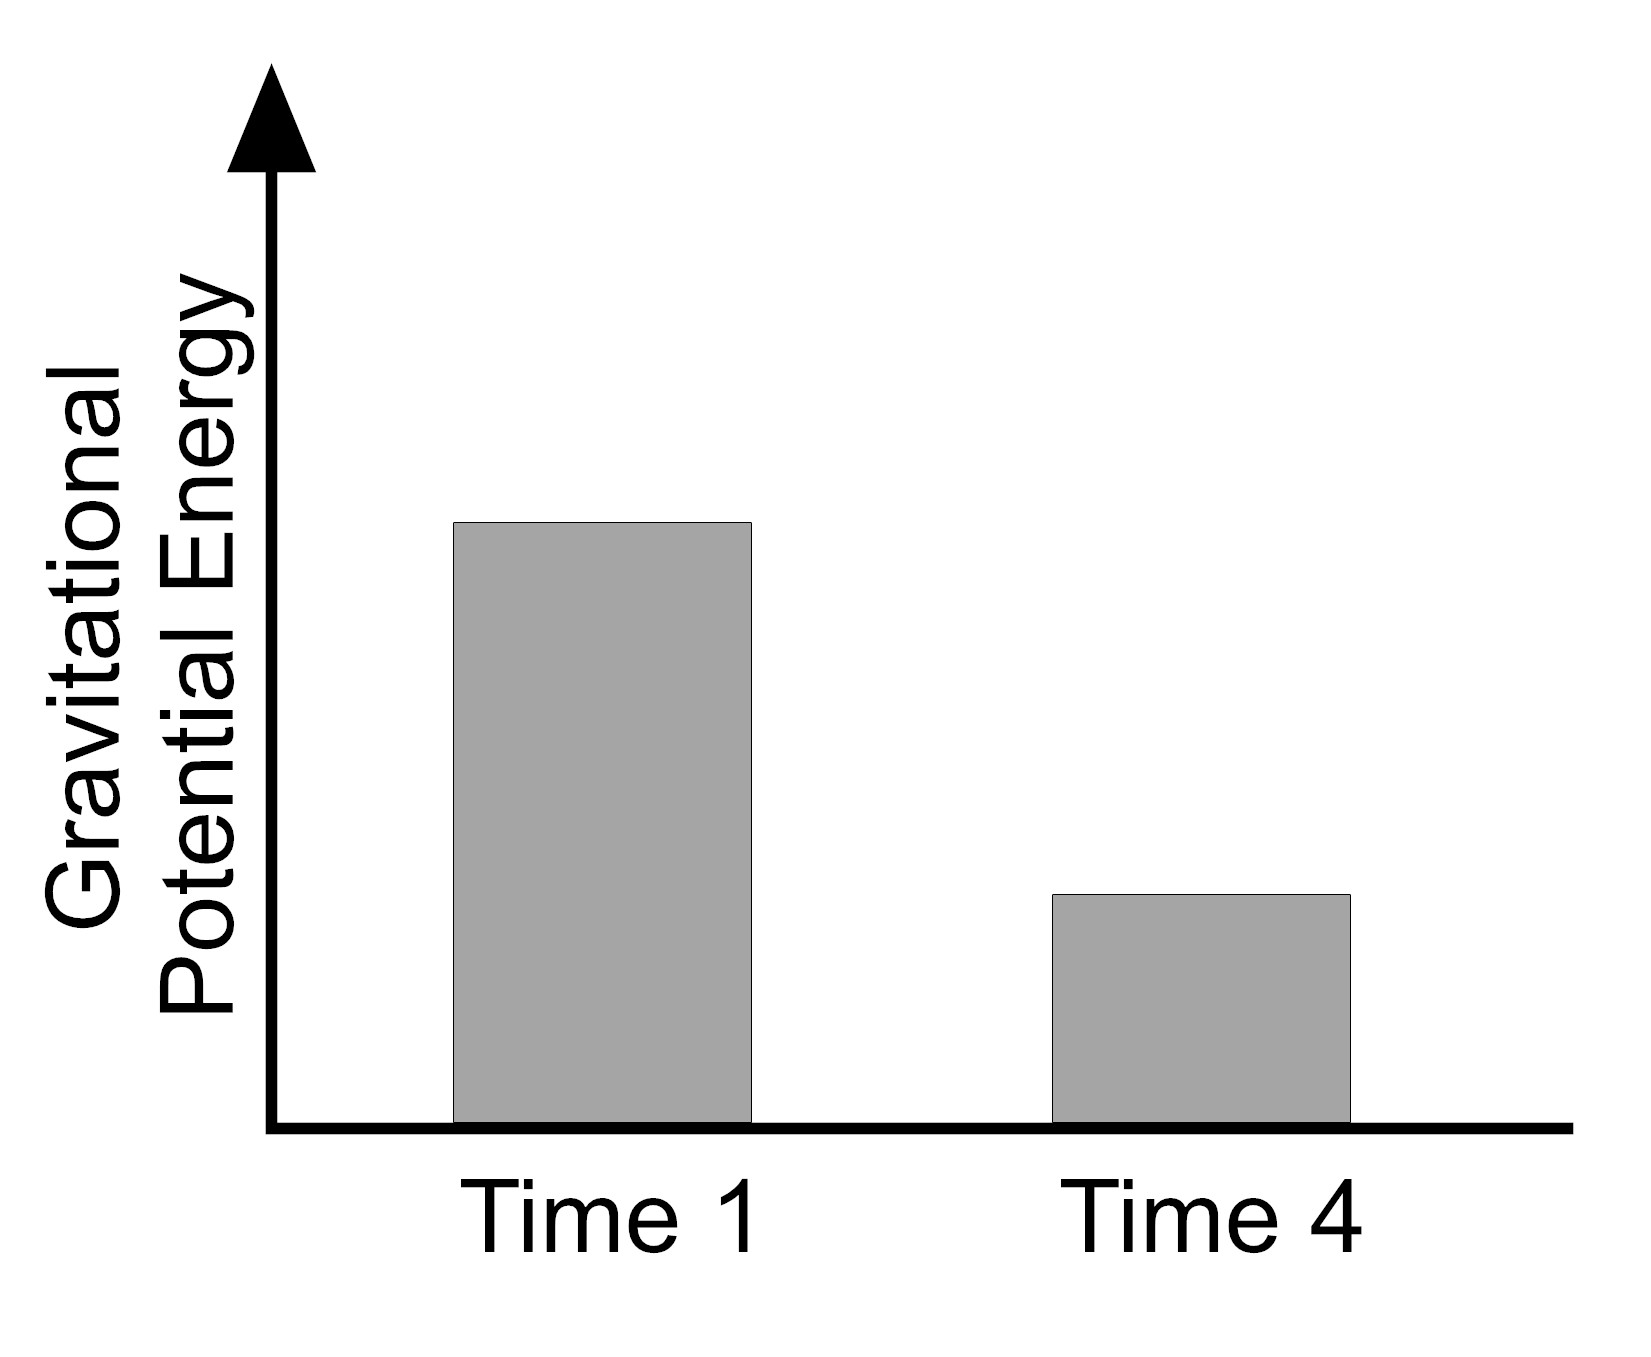
3. To make sense of the patterns she sees in the data, the athlete graphs the gravitational potential energy at the initial height (Time 1) and the final height (Time 4) for the first trial with the tennis ball. Which bar graph represents the amount of gravitational potential energy in the tennis ball-Earth system at Time 1 and Time 4?
| A. |
|
B. |
|
| C. |
|
||
4. Now the athlete decides to think about the kinetic energy of the tennis ball. She looks at the speed of each ball right before it hits the ground (Time 2) and right after it hits the ground (Time 3). She measures the speeds when the ball is at the same height before and after it hits the ground. She drops the tennis ball three times and records the data in the table below. She also notices that there is a sound produced each time the tennis ball hits the ground.
| Trial |
Speed at Time 2: Right before hitting the ground (meters/sec) |
Speed at Time 3: Right after hitting the ground (meters/sec) |
| 1 | 4.07 m/s | 3.32 m/s |
| 2 | 4.05 m/s | 3.30 m/s |
| 3 | 4.08 m/s | 3.33 m/s |
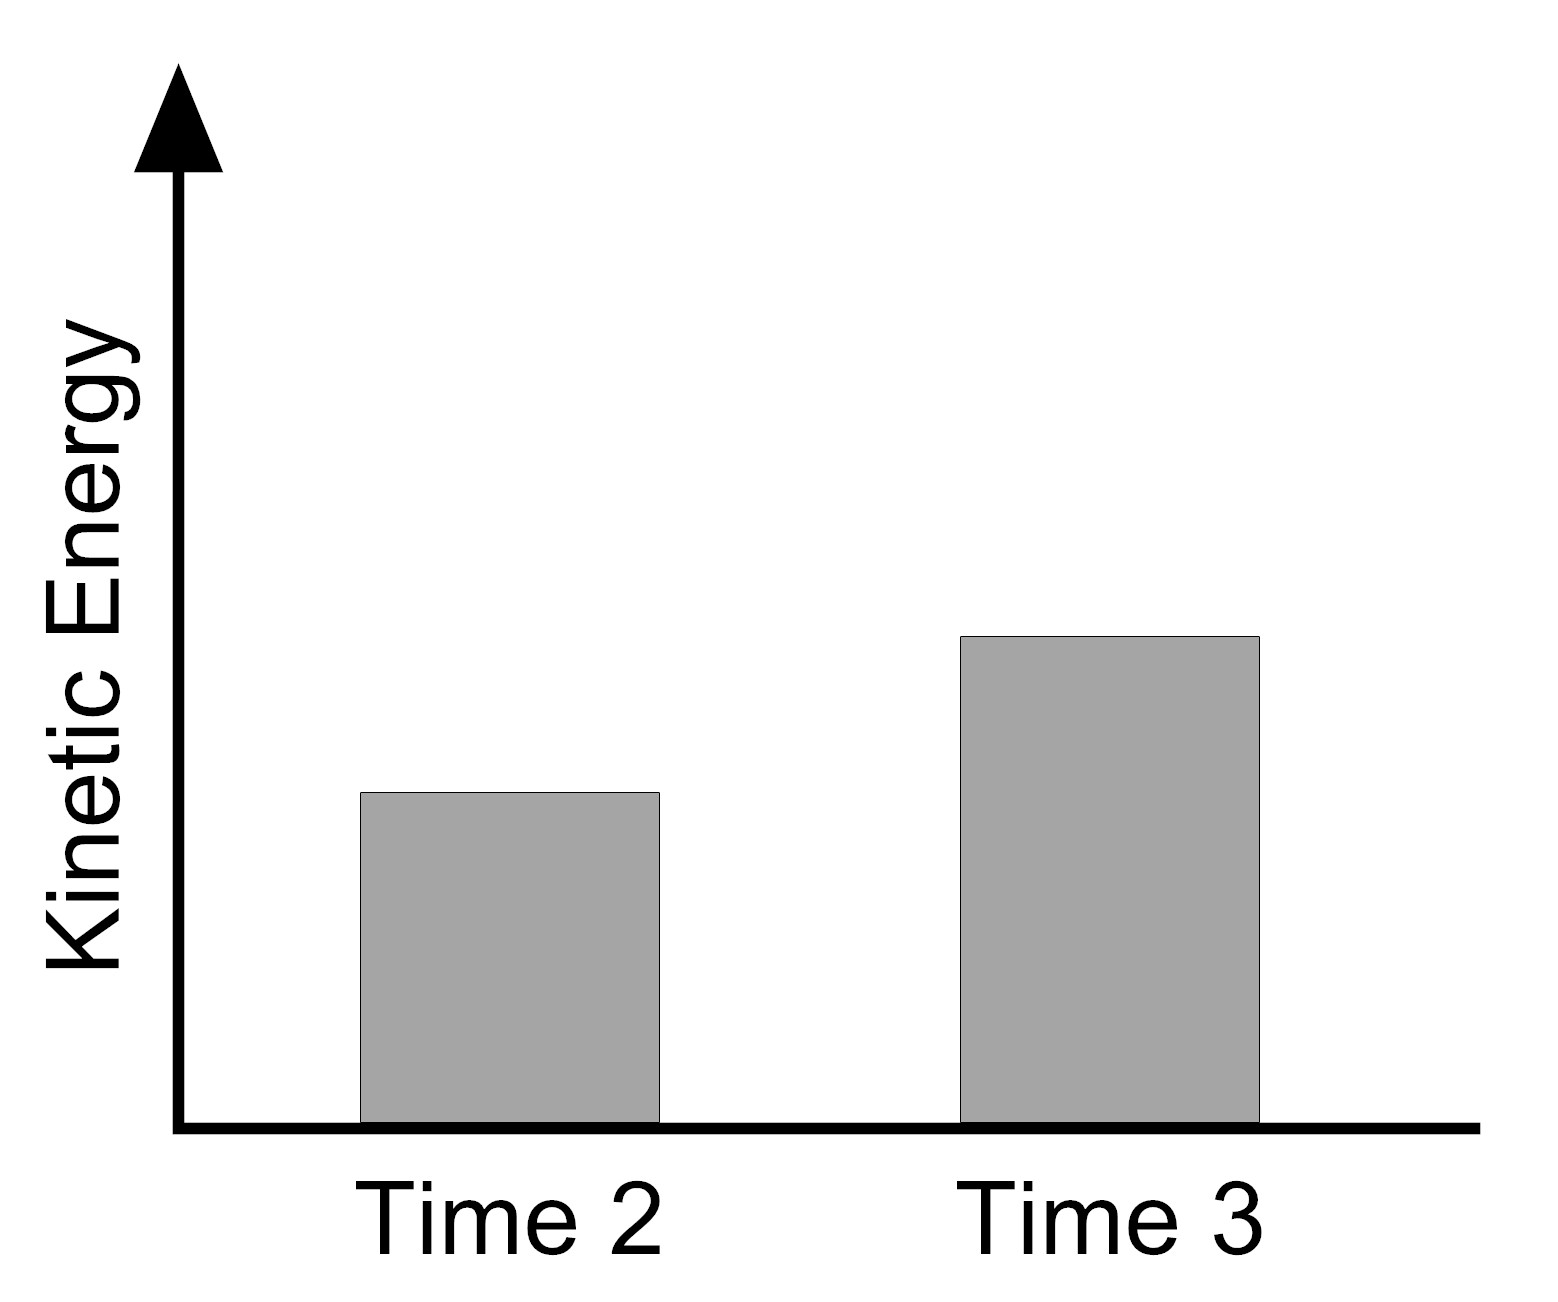
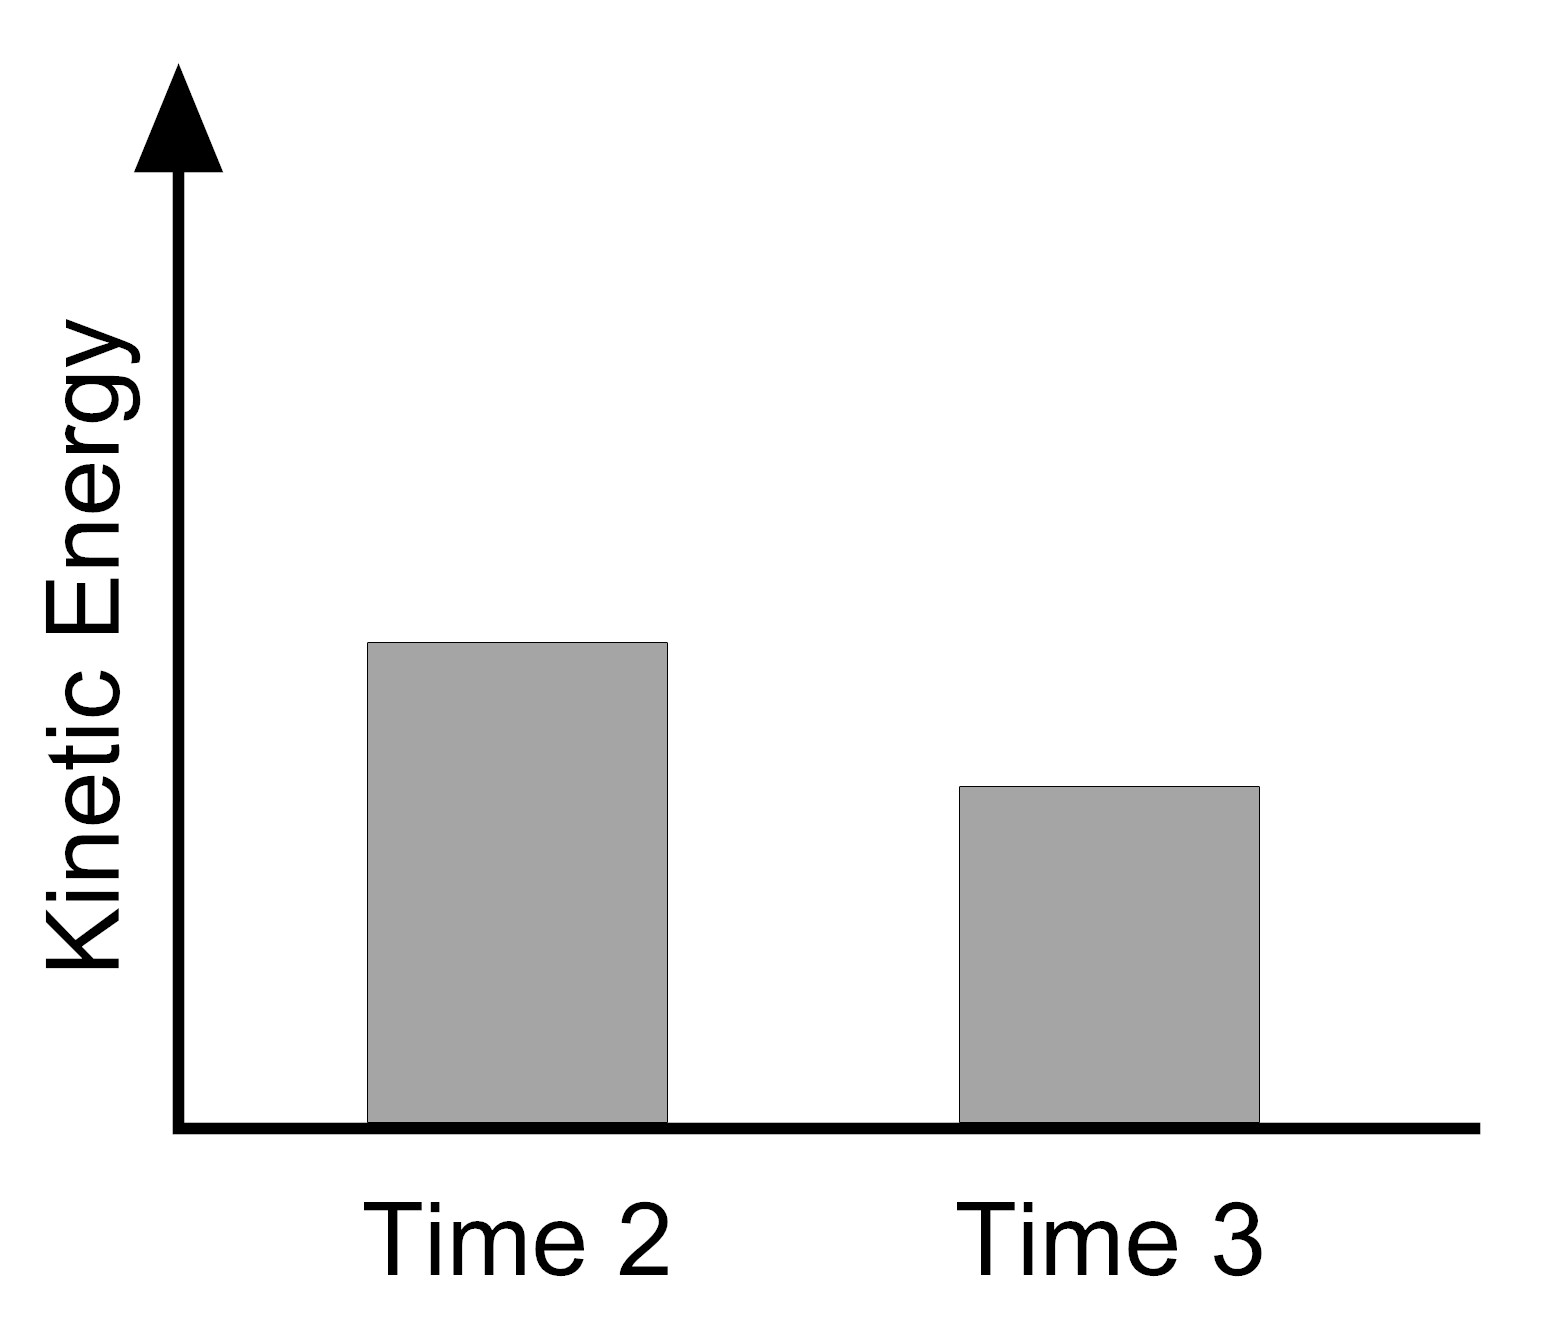
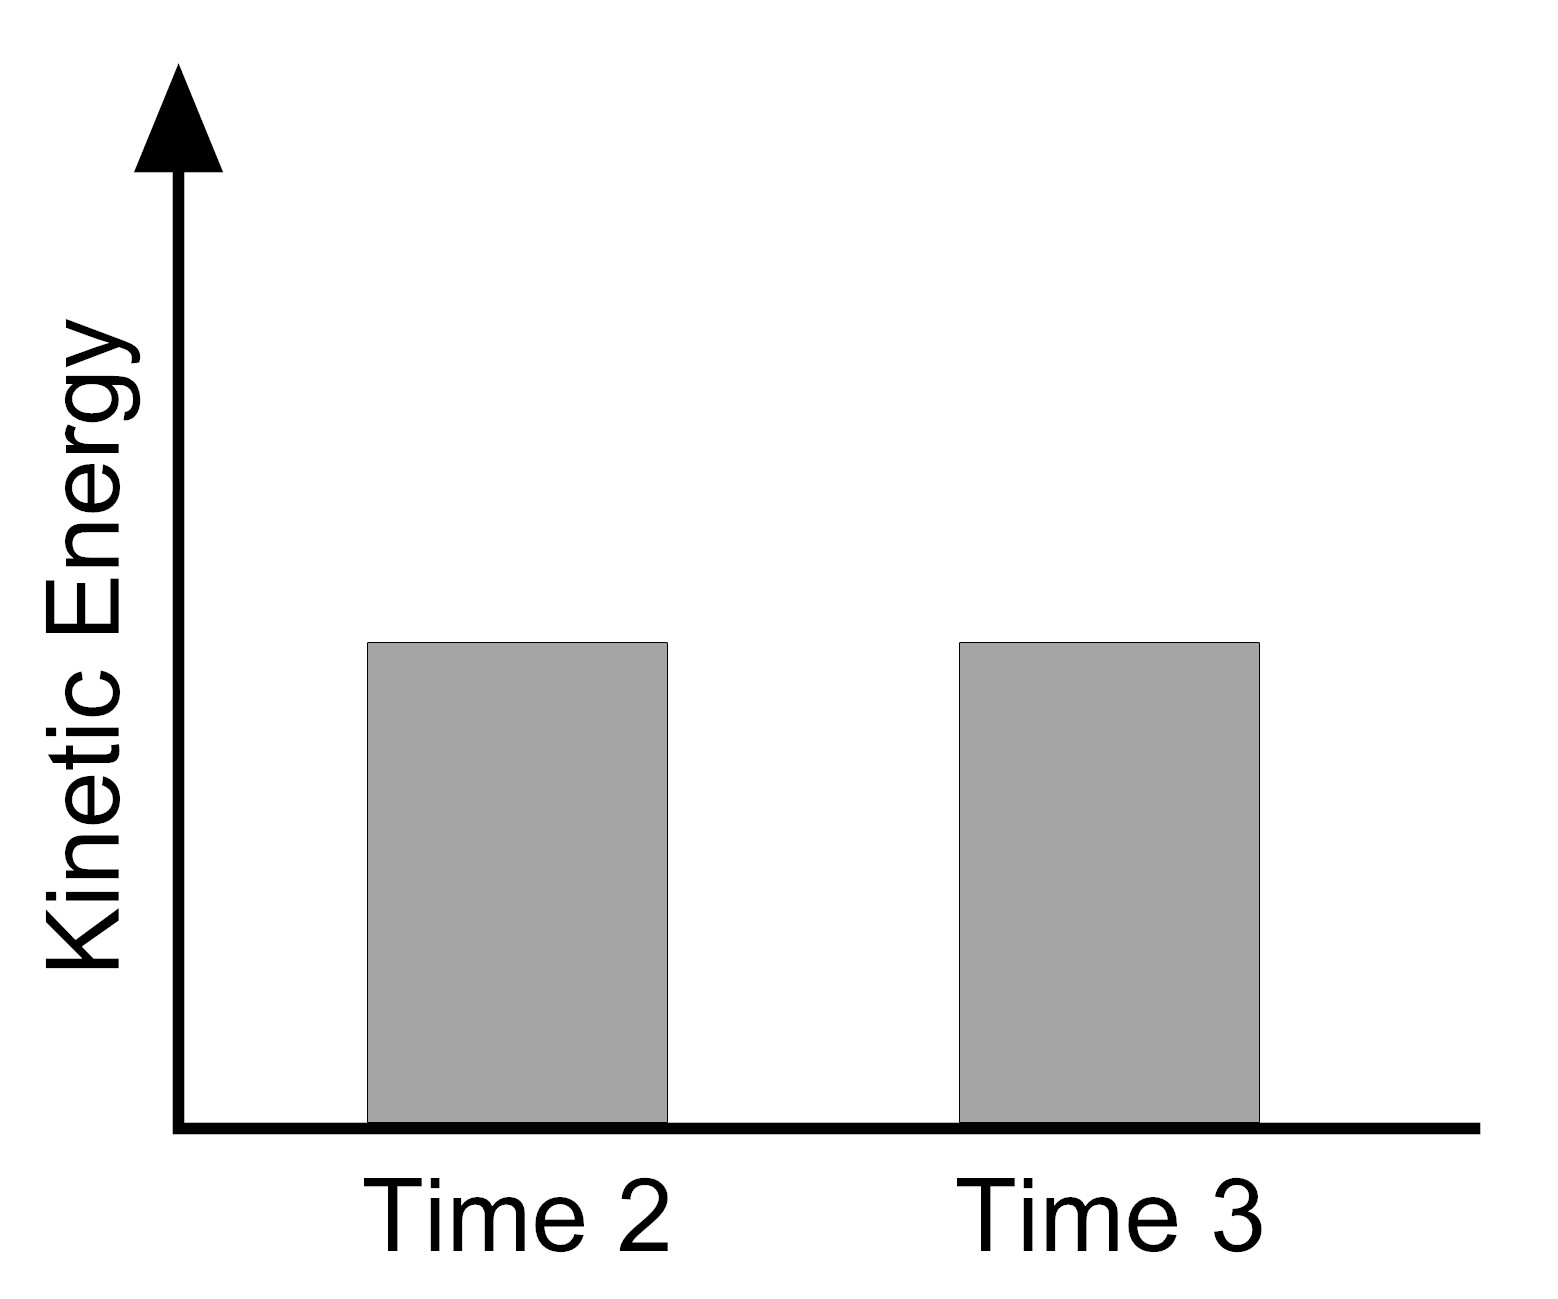
Which bar graph represents the amount of kinetic energy the tennis ball has at Time 2 (right before hitting the ground) and at Time 3 (right after hitting the ground)? (The graphs show the data averaged over the three trials.)
| A. |
|
B. |
|
| C. |
|
||
5. What other data besides speed, height, and mass could the athlete collect that would help explain why the balls reached a lower height after bouncing, and how would this additional data support the explanation? Choose all that apply.
A. The athlete could measure the size of the ball because the amount of energy an object has depends on its size.
B. The athlete could measure the force of gravity on the ball because the force of gravity is changed into energy when the ball hits the ground.
C. The athlete could measure the loudness of the sound made when the ball hits the ground because sound is an indicator that energy was transferred to the air.
D. The athlete could measure the temperature of the ground where the ball hit before and after the ball bounces because an increase in temperature is an indicator that energy is transferred from the ball to the ground.
6. The athlete now thinks she knows enough to make sense of the observations she made when the balls are bounced separately. Write your own explanation for why the balls don’t bounce as high as the initial height when bounced separately. Be sure to include in your explanation:
- the speed data that the athlete collected,
- the athlete’s observations about sound,
- the bar graphs that she drew, and
- ideas about energy transfer.
7. Now the athlete returns to the question of why the stacked balls bounce as they do. She tries to use what she learned from the bounce of the individual tennis ball and basketball to explain what happened when she dropped the two balls stacked on top of each other. The athlete make the following observations about the stacked bounce.
- The basketball with the tennis ball on top of it hits the ground and bounces up.
- The basketball exerts a force on the tennis ball as it bounces back up.
- The basketball doesn’t bounce as high during the stacked bounce as it did when it was dropped by itself.
- The tennis ball bounces higher during the stacked bounce than it did when it was dropped by itself.
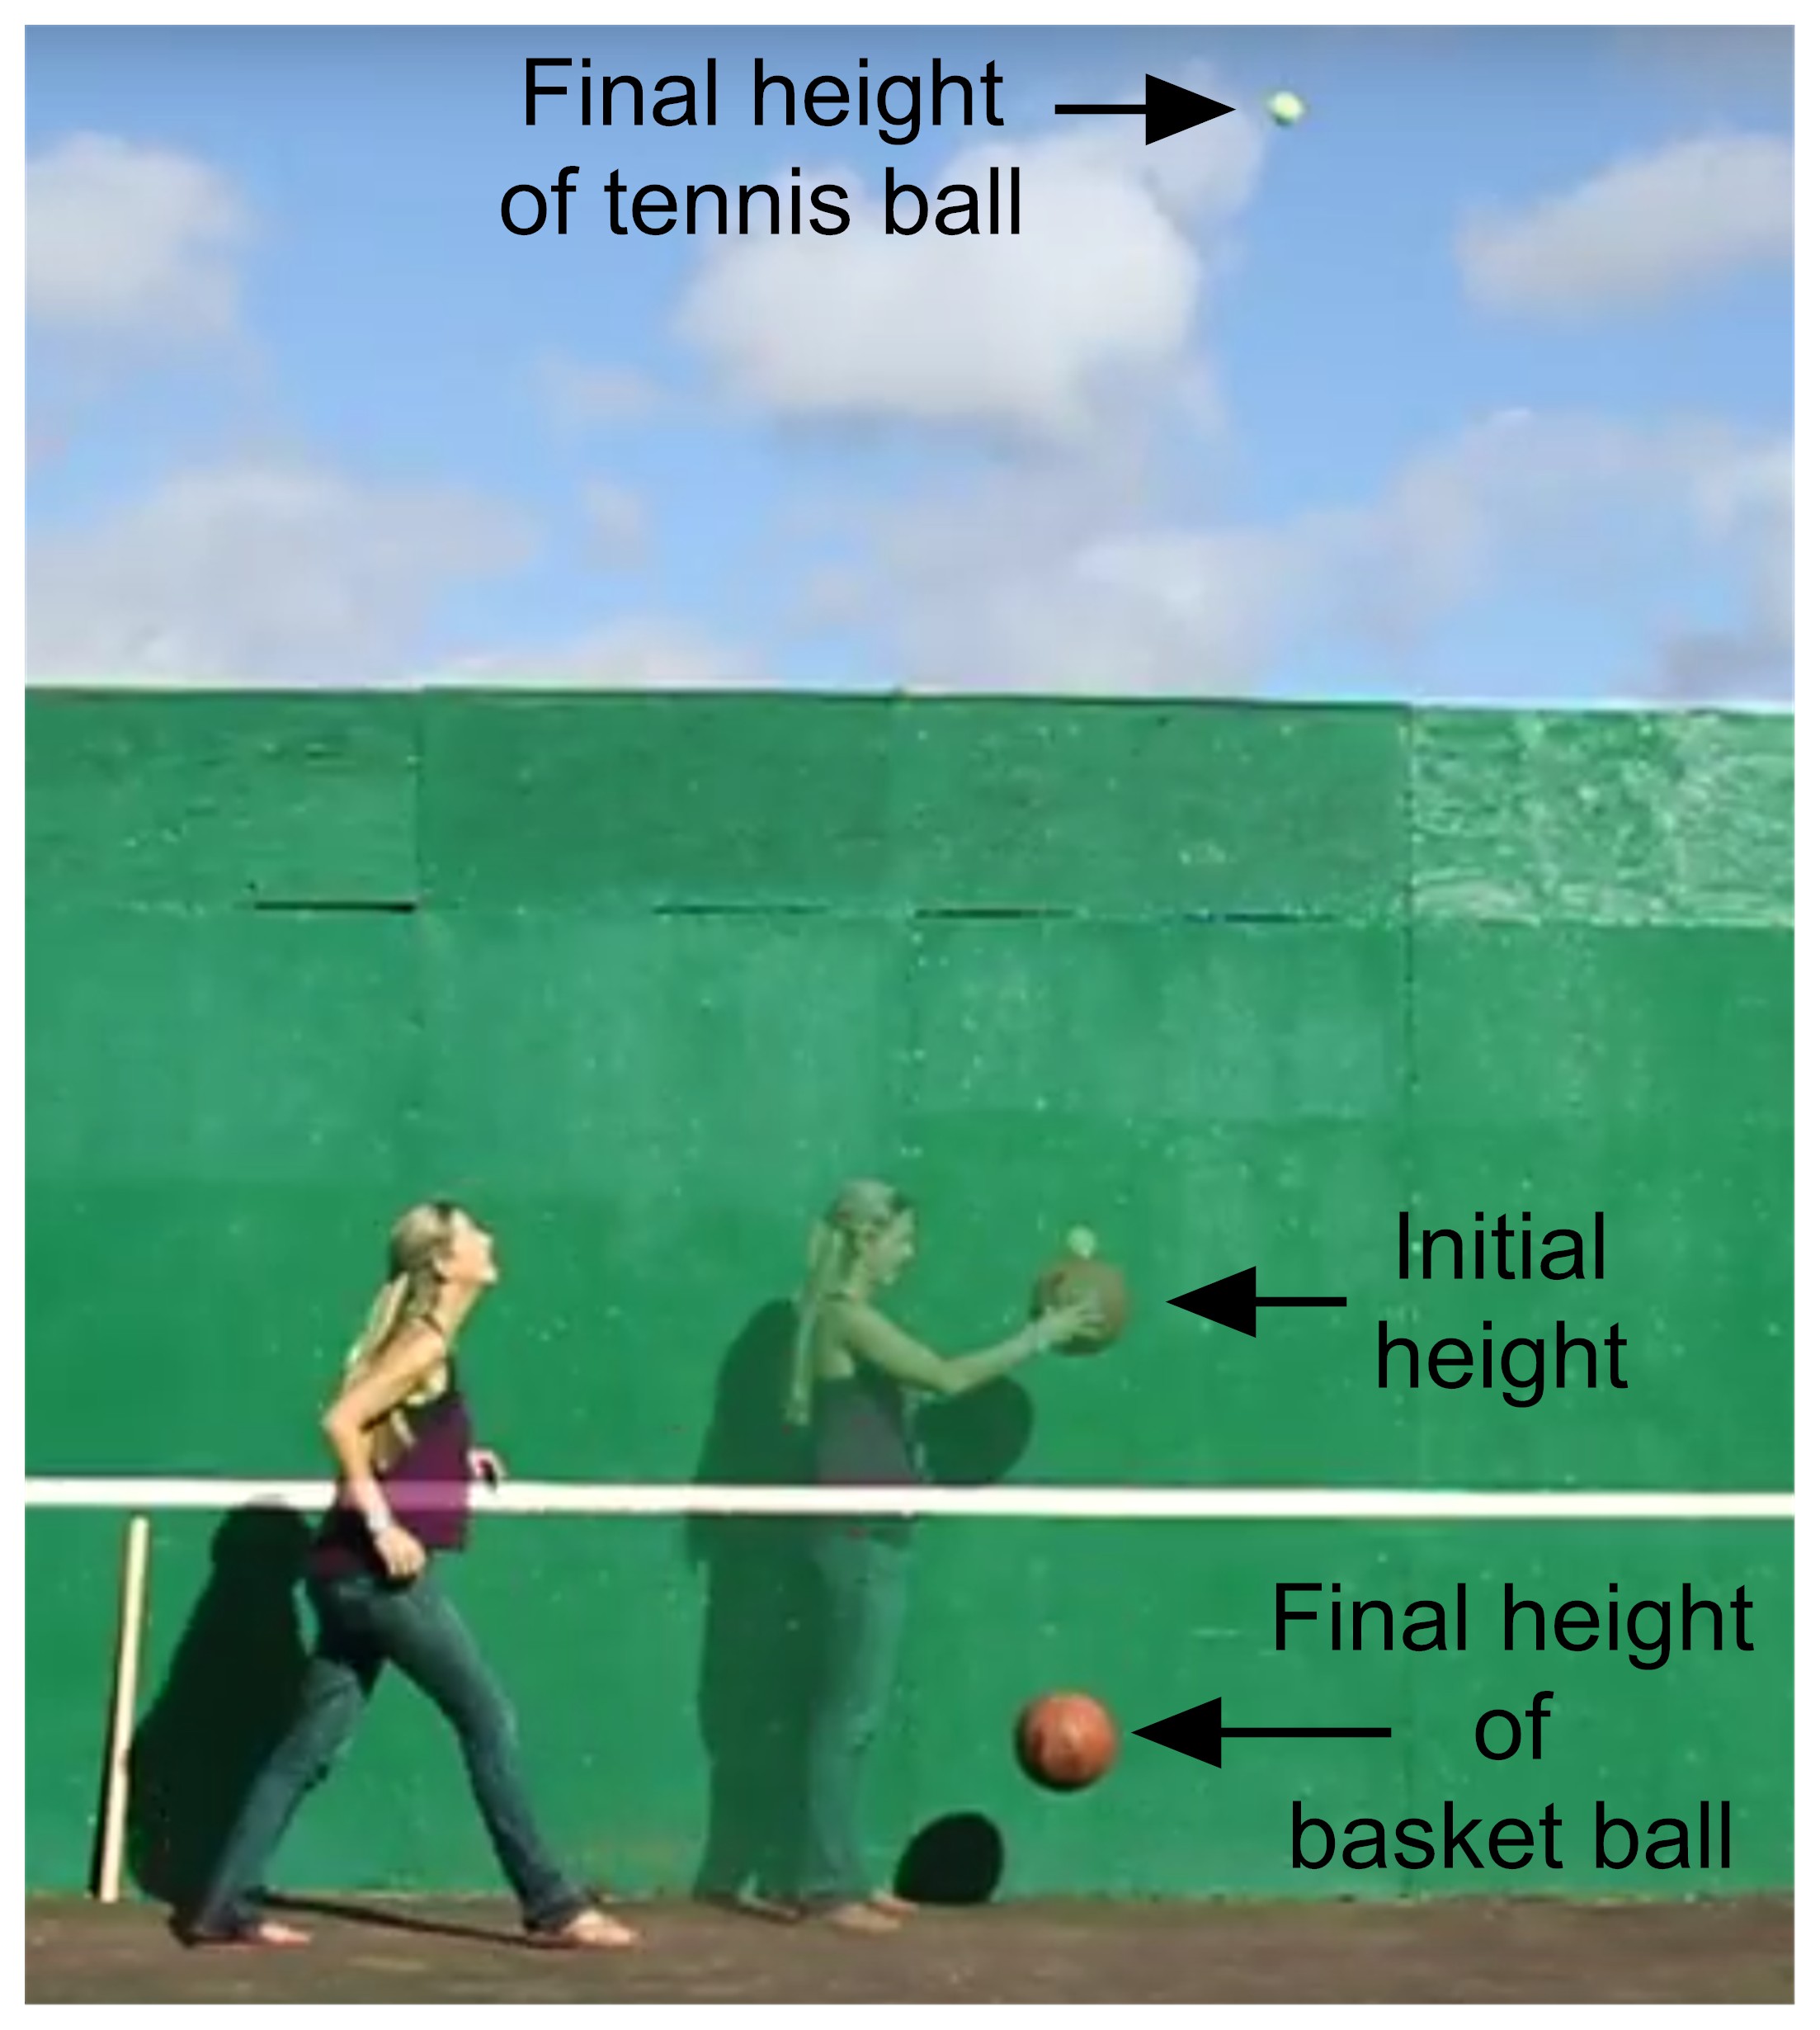
Using ideas about energy transfer, explain why the tennis ball bounces higher during the stacked bounce than when it was dropped by itself and why the basketball doesn’t bounce as high during the stacked bounce as it did when it was dropped by itself.
- Percent of Points Earned

- Points Earned
| Avg. Earned | Possible | Percent | |
|---|---|---|---|
| Q1 | 0.68 | 1 | 68% |
| Q2 | 0.62 | 1 | 62% |
| Q3 | 0.54 | 1 | 54% |
| Q4 | 0.42 | 1 | 42% |
| Q5 | 0.43 | 2 | 22% |
| Q6 | 0.47 | 5 | 9% |
| Q7 | 0.86 | 5 | 17% |
- Overall Task Difficulty
| Total Points Earned | Total Points Possible | Total Percent | |
|---|---|---|---|
| 4.03 | 16 | 25% |
n = 219
Note: The total percent is a weighted average based on the total number of points earned divided by the total number of points possible.
- Science and Engineering Practices
- SEP4 Construct, analyze, and/or interpret graphical displays of data and/or large data sets to identify linear and nonlinear relationships.
SEP4 Analyze and interpret data to provide evidence for phenomena.
SEP6 Apply scientific ideas, principles, and/or evidence to construct, revise and/or use an explanation for realworld phenomena, examples, or events.
SEP7 Construct, use, and/or present an oral and written argument supported by empirical evidence and scientific reasoning to support or refute an explanation or a model for a phenomenon or a solution to a problem - Crosscutting Concepts
- CC1 Graphs, charts, and images can be used to identify patterns in data.
CC5 Energy may take different forms (e.g. energy in fields, thermal energy, energy of motion).
CC5 The transfer of energy can be tracked as energy flows through a designed or natural system. - Disciplinary Core Ideas
- PS3.A Motion energy is properly called kinetic energy; it is proportional to the mass of the moving object and grows with the square of its speed.
PS3.A A system of objects may also contain stored (potential) energy, depending on their relative positions.
PS3.B When the motion energy of an object changes, there is inevitably some other change in energy at the same time.
PS3.C When two objects interact, each one exerts a force on the other that can cause energy to be transferred to or from the object.


