Item AP003006: Identify plausible explanations of experimental data on temperature changes for two coolants. Evaluate an experiment to determine which coolant is better to use in an engine.
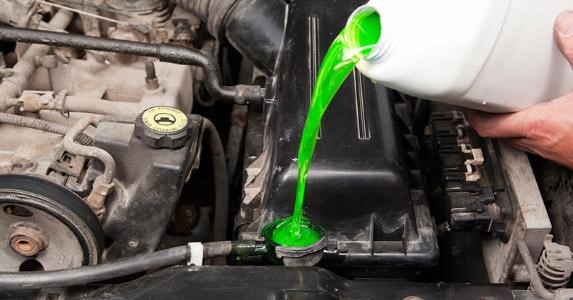
When a car's engine is running, the engine can get extremely hot, so a liquid coolant is used to help cool the engine.

An engineer is studying two different coolants. He would like to know which of the two is a better coolant. A good coolant is one that has only a small temperature increase when it is heated. To help him figure out which coolant is better, he sets up an experiment. The procedure for the experiment is below:
Step 1: Pour each coolant into a separate metal container.
Step 2: Measure the temperature of the coolant in each container using a thermometer.
Step 3: Heat each coolant on the stove at the same heat setting.
Step 4: Measure the temperature of each coolant after it has been heated.
He records his temperature measurements in a table.
| Coolant A | Coolant B | |
| Before being heated | 15 oC | 15 oC |
| After being heated | 51 oC | 94 oC |
The engineer thinks Coolant A is better than Coolant B. Another engineer points out that his conclusions may not be correct because the test of the coolants may not have been fair. There could be several other ways to get the same results shown in the table.
1. The engineers decide to list some reasons why the two coolants could have different temperatures after they were heated. For each of the responses below select yes or no to indicate whether or not the reason listed could explain why two coolants have different temperatures after they are heated.
|
Yes | No |
|
Yes | No |
|
Yes | No |
Now, it’s your job to design an experiment to figure out which coolant has the smallest temperature increase when it is heated.
2. What should vary in your experiment and what should be held constant? Select a response for each.
| Should vary | Should be held constant | |
|
||
|
||
|
||
|
3. Based on your answers to the previous questions, what revisions need to be made to the engineer's procedure?
- Percent of Points Earned

- Points Earned
| Avg. Earned | Possible | Percent | |
|---|---|---|---|
| Q1 | 2.09 | 3 | 70% |
| Q2 | 2.4 | 4 | 60% |
| Q3 | 0.56 | 2 | 28% |
- Overall Task Difficulty
| Total Points Earned | Total Points Possible | Total Percent | |
|---|---|---|---|
| 5.04 | 9 | 56% |
n = 230
Note: The total percent is a weighted average based on the total number of points earned divided by the total number of points possible.
- Science and Engineering Practices
- SEP3 Plan an investigation individually and collaboratively, and in the design: identify independent and dependent variables and controls, what tools are needed to do the gathering, how measurements will be recorded, and how many data are needed to support a claim.
SEP3 Conduct an investigation and/or evaluate and/or revise the experimental design to produce data to serve as the basis for evidence that meet the goals of the investigation. - Disciplinary Core Ideas
- PS3.A Temperature is a measure of the average kinetic energy of particles of matter. The relationship between the temperature and the total energy of a system depends on the types, states, and amounts of matter present.

