ASPECt 3D
![]() 3D Energy Tasks
3D Energy Tasks
![]() When objects collide, contact forces can transfer energy from one object to another resulting in a change in the…
When objects collide, contact forces can transfer energy from one object to another resulting in a change in the…
Item AP035006: Make a prediction about how pool balls will move and construct an explanation that relates the speed of a ball and the amount of energy it can transfer when it hits another ball. (CR version)

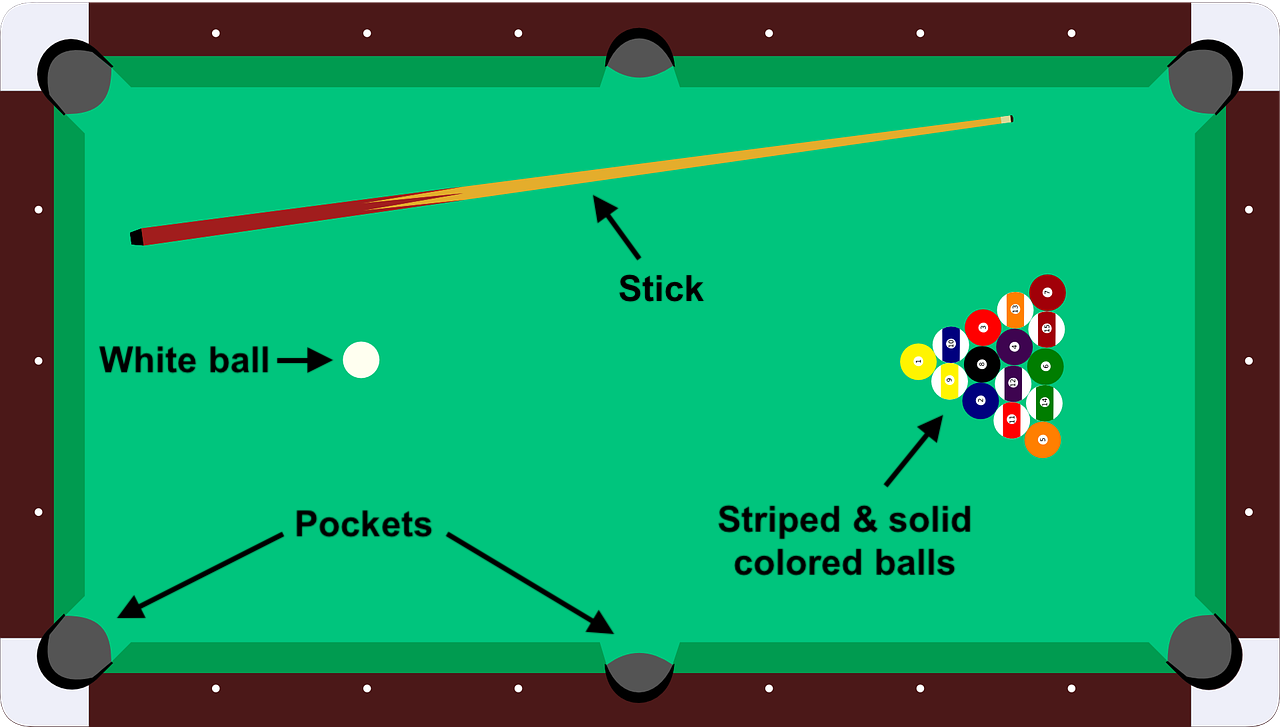
In the game of pool, players use a stick to hit a white ball into a colored ball so that the colored ball will fall into a pocket on the sides and corners of the pool table. Players lose their turn if the white ball goes into the pocket.
A new pool player wants to do an investigation that will help him learn how hard to hit the white ball into a colored ball so that only the colored ball goes into a pocket. He decides to hit the white ball into the solid green ball a couple of times and make observations. He made a video of each time he hit the ball. Watch the videos and then complete the data table below.
| Try 1 | Try 2 |
|
|
|
1. Summarize your observations by completing the data table below.
| Try | Strength of hit | Speed of white ball before hitting the green ball | Speed of green ball after being hit | Did the green ball fall into the pocket? | Did the white ball fall into the pocket? | Change in speed of white ball after hitting the green ball | ||
| 1 | Soft | |||||||
| 2 | Hard |
2. How does the speed of the green ball in Try 1 compare to the speed of the green ball in Try 2?
A. The green ball rolls faster in Try 1 than it did in Try 2.
B. The green ball rolls slower in Try 1 than it did in Try 2.
C. The green ball’s speed was the same in both tries.
3. What pattern do you see in the change in the speed of the white ball after it hits the green ball?
A. The white ball's speed decreases after it hits the green ball in both tries.
B. The white ball's speed increases after it hits the green ball in both tries.
C. There is no pattern in the change in speed of the white ball.
4. Now that the player has made some observations, he wants to use what he knows about energy to think about what he has seen. How does the amount of energy the green ball has while rolling in Try 1 compare to the amount of energy it has while rolling in Try 2?
A. The green ball has more energy while rolling in Try 1 than in Try 2.
B. The green ball has less energy while rolling in Try 1 than in Try 2.
C. The green ball has the same amount of energy while rolling in Try 1 and Try 2.
5a. Where did the energy the green ball has while rolling come from?
A. The energy the green ball has while rolling came from inside the green ball.
B. The energy the green ball has while rolling was made when the white ball hit the green ball. The energy did not exist before that.
C. When the white ball hit the green ball, energy moved from the white ball to the green ball.
D. When the white ball hit the green ball, the white ball used a force to push the green ball. That force turned into energy that was given to the green ball.
5b. What evidence do you have to support your answer to where the green ball’s energy came from?
6. The player wants to do a third try to see if he can get just the green ball to fall into the pocket and not the white ball. Using the patterns he observed during Tries 1 and 2, how hard should he hit the white ball in Try 3?
A. He should hit the white ball softer than Try 1.
B. He should hit the white ball the same as in Try 1.
C. He should hit the white ball harder than Try 1 but not as hard as Try 2.
D. He should hit the white ball the same as in Try 2.
E. He should hit the white ball harder than Try 2.
7a. How much energy will the white ball have after hitting the green ball in Try 3?
A. The white ball will have less energy after hitting the green ball than before hitting the green ball.
B. The white ball will have more energy after hitting the green ball than before hitting the green ball.
C. The white ball will have the same amount of energy before and after hitting the green ball.
7b. Use the patterns in your table and ideas about energy to explain the prediction you made about the amount of energy the white ball will have after hitting the green ball in Try 3.
- Percent of Points Earned

- Points Earned
| Avg. Earned | Possible | Percent | |
|---|---|---|---|
| Q1 | 2.22 | 3 | 74% |
| Q2 | 0.88 | 1 | 88% |
| Q3 | 0.63 | 1 | 63% |
| Q4 | 0.86 | 1 | 86% |
| Q5a & Q5b | 0.5 | 2 | 25% |
| Q6 | 0.78 | 1 | 78% |
| Q7a & Q7b | 0.86 | 4 | 22% |
- Overall Task Difficulty
| Total Points Earned | Total Points Possible | Total Percent | |
|---|---|---|---|
| 6.73 | 13 | 52% |
n = 280
Note: The total percent is a weighted average based on the total number of points earned divided by the total number of points possible.
- None identified