MEGA
![]() Energy in Biology
Energy in Biology
![]() Cellular respiration is a chemical process in which the bonds between atoms of food molecules and oxygen molecul…
Cellular respiration is a chemical process in which the bonds between atoms of food molecules and oxygen molecul…
Item EB029002: When scientists compared the amount of oxygen consumed during yoga and waking at 3 miles per hour they found that more oxygen was consumed during walking at 3 miles per hour and concluded that more glucose was consumed under those conditions.

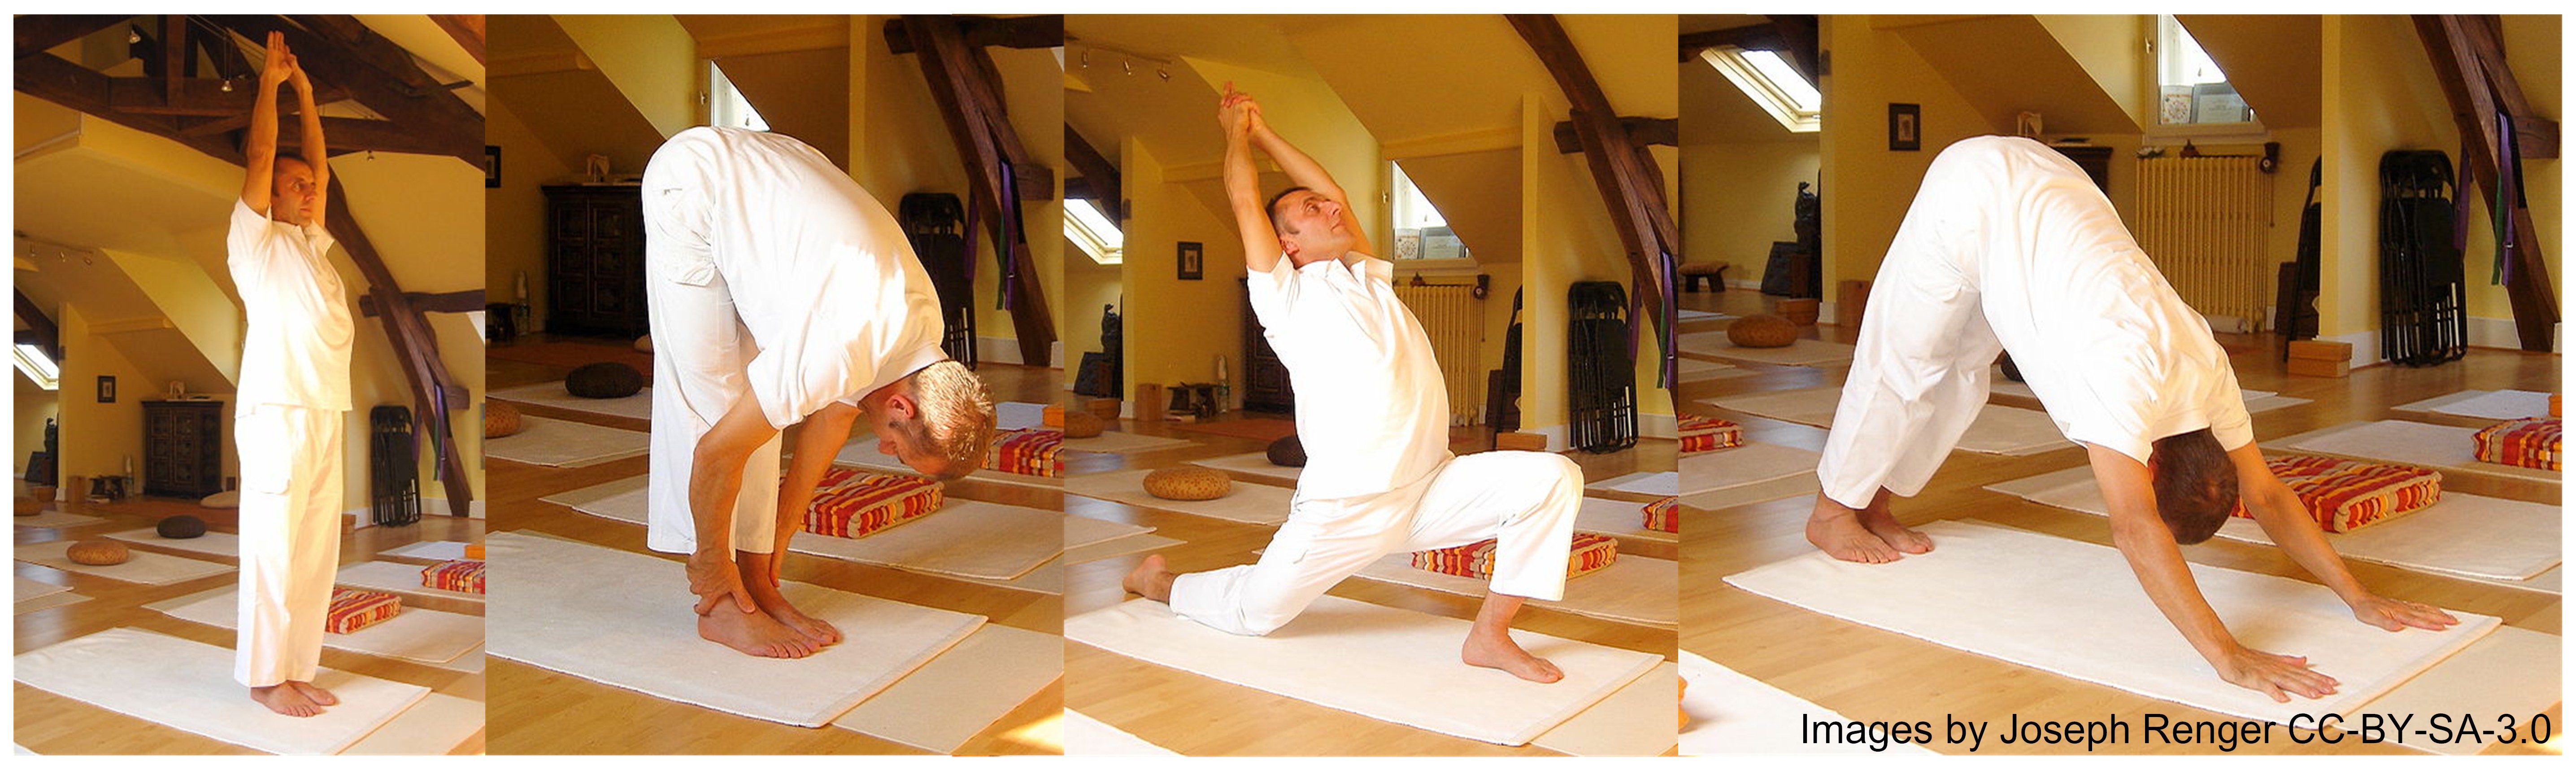
A group of scientists was interested in finding out how the amount of energy needed to do yoga exercises compared to other forms of exercise. During a typical yoga session, a person moves through a series of poses like the ones shown below.
The scientist recruited 20 people to participate in the study. They first had each person rest for 30 minutes by sitting still in a chair. Then each person moved through a series of standing and sitting yoga poses for 56 minutes. Finally, each person walked on a treadmill at two different speeds (2 miles per hour and 3 miles per hour) for 10 minutes at each speed.
During each part of the study, the scientists determined how much oxygen each person used by calculating the difference between the amount of oxygen inhaled and the amount of oxygen exhaled. The table below presents the average amount of oxygen used during each activity.
| Activity | Amount of Oxygen Used (l/kg/min) |
| Resting | 0.3 |
| Yoga | 0.6 |
| Walking at 2 miles per hour | 0.7 |
| Walking at 3 miles per hour | 0.9 |
What do the relative amounts of oxygen used during yoga and walking at 3 miles per hour tell the scientist about the relative amounts of glucose burned during these activities?
- There is more glucose burned when walking at 3 miles per hour than when doing yoga.
- There is more glucose burned when doing yoga than when walking at 3 miles per hour.
- There are similar amounts of glucose burned when walking at 3 miles per hour and while doing yoga.
- The relative amounts of oxygen used do not tell the scientists anything about the relative amounts of glucose burned during the activities.
- Distribution of Responses

- Points Earned
| Group | Correct | Total | Percent |
|---|---|---|---|
| Overall | 77 | 176 | 44% |
| Grades | |||
| 6–8 | N/A | N/A | N/A |
| 9–12 | 65 | 153 | 42% |
| Gender | |||
| Male | 42 | 97 | 43% |
| Female | 27 | 58 | 47% |
| Primary Language | |||
| English | 63 | 148 | 43% |
| Other | 5 | 12 | 42% |
- Distribution of Responses

- Points Earned
| Group | Correct | Total | Percent |
|---|---|---|---|
| Overall | 119 | 176 | 68% |
| Grades | |||
| 6–8 | N/A | N/A | N/A |
| 9–12 | 103 | 156 | 66% |
| Gender | |||
| Male | 59 | 89 | 66% |
| Female | 43 | 67 | 64% |
| Primary Language | |||
| English | 96 | 148 | 65% |
| Other | 6 | 7 | 86% |
- Disciplinary Core Ideas
- PS3.D Cellular respiration in plants and animals involve chemical reactions with oxygen that release stored energy. In these processes, complex molecules containing carbon react with oxygen to produce carbon dioxide and other materials.
LS1.C As a result of these chemical reactions, energy is transferred from one system of interacting molecules to another. Cellular respiration is a chemical process in which the bonds of food molecules and oxygen molecules are broken and new compounds are formed that can transport energy to muscles. Cellular respiration also releases the energy needed to maintain body temperature despite ongoing energy transfer to the surrounding environment.