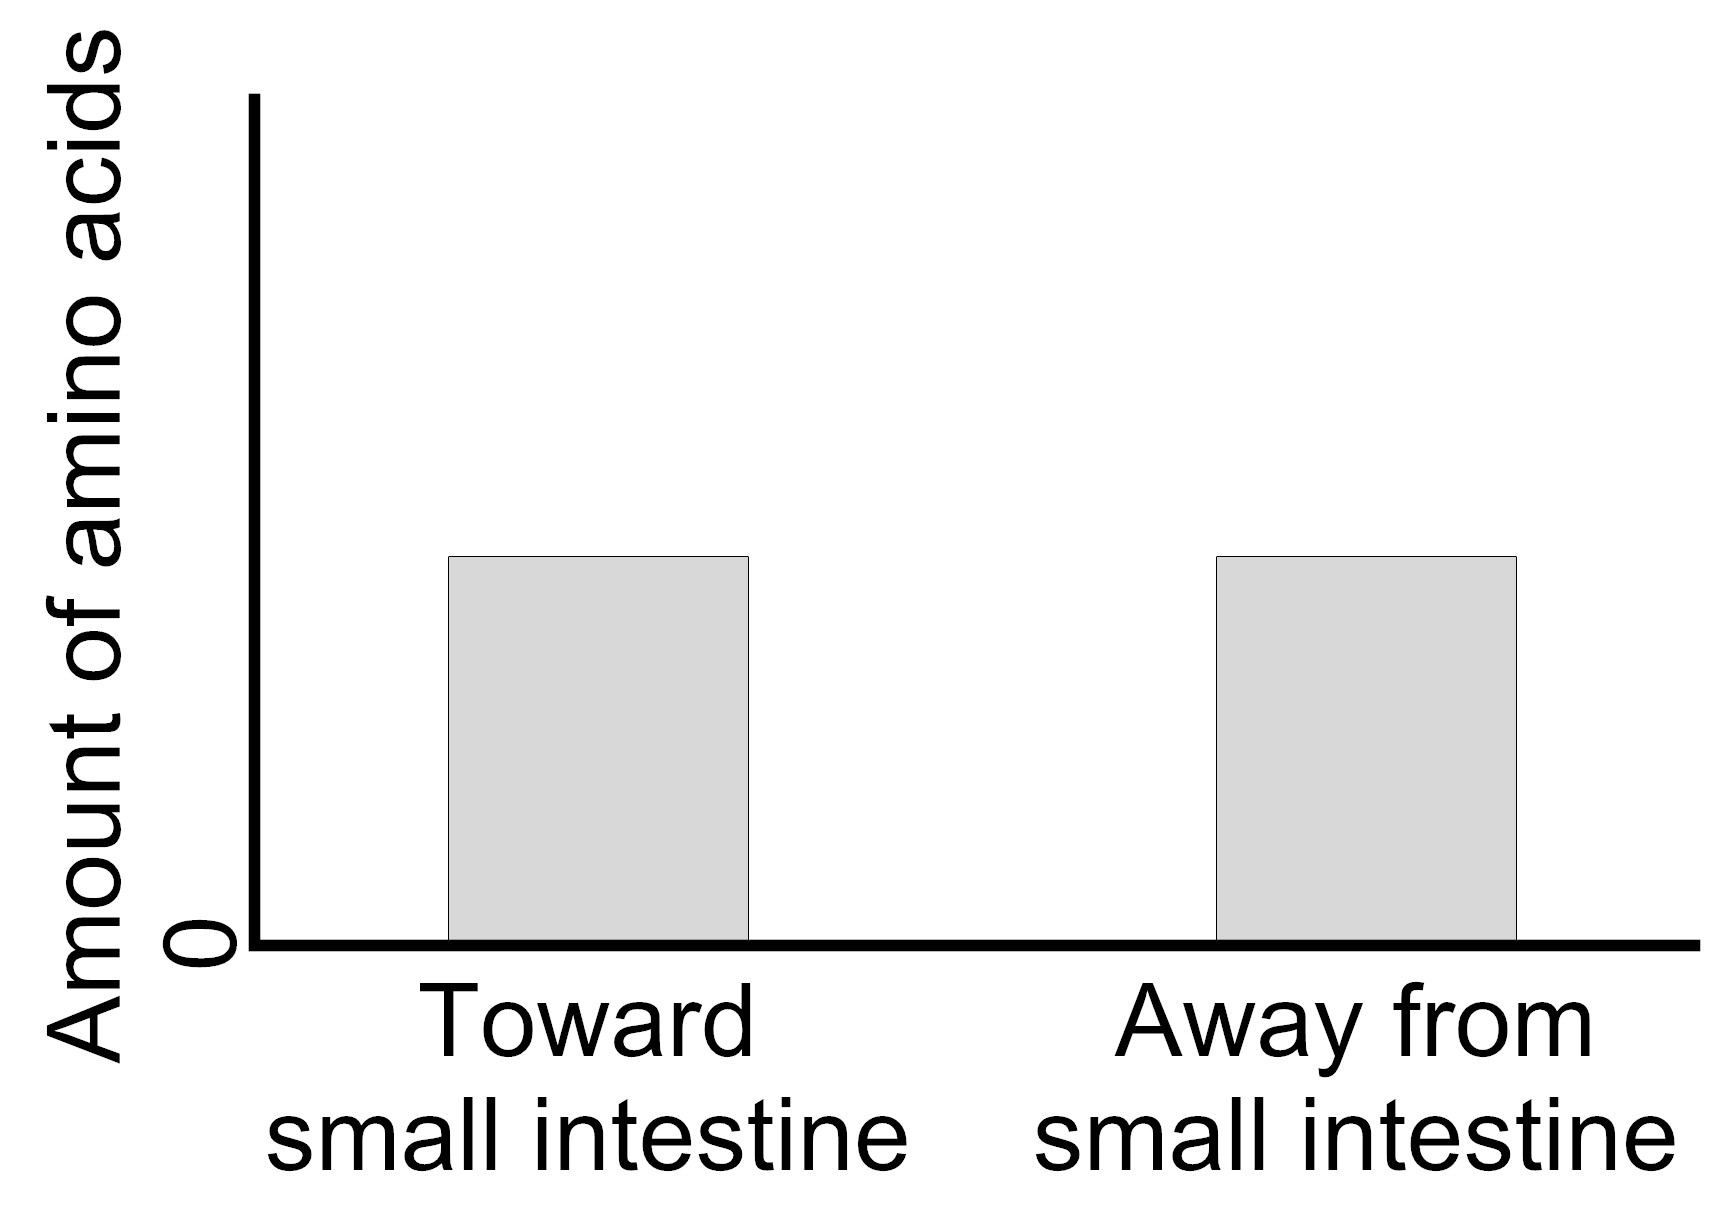
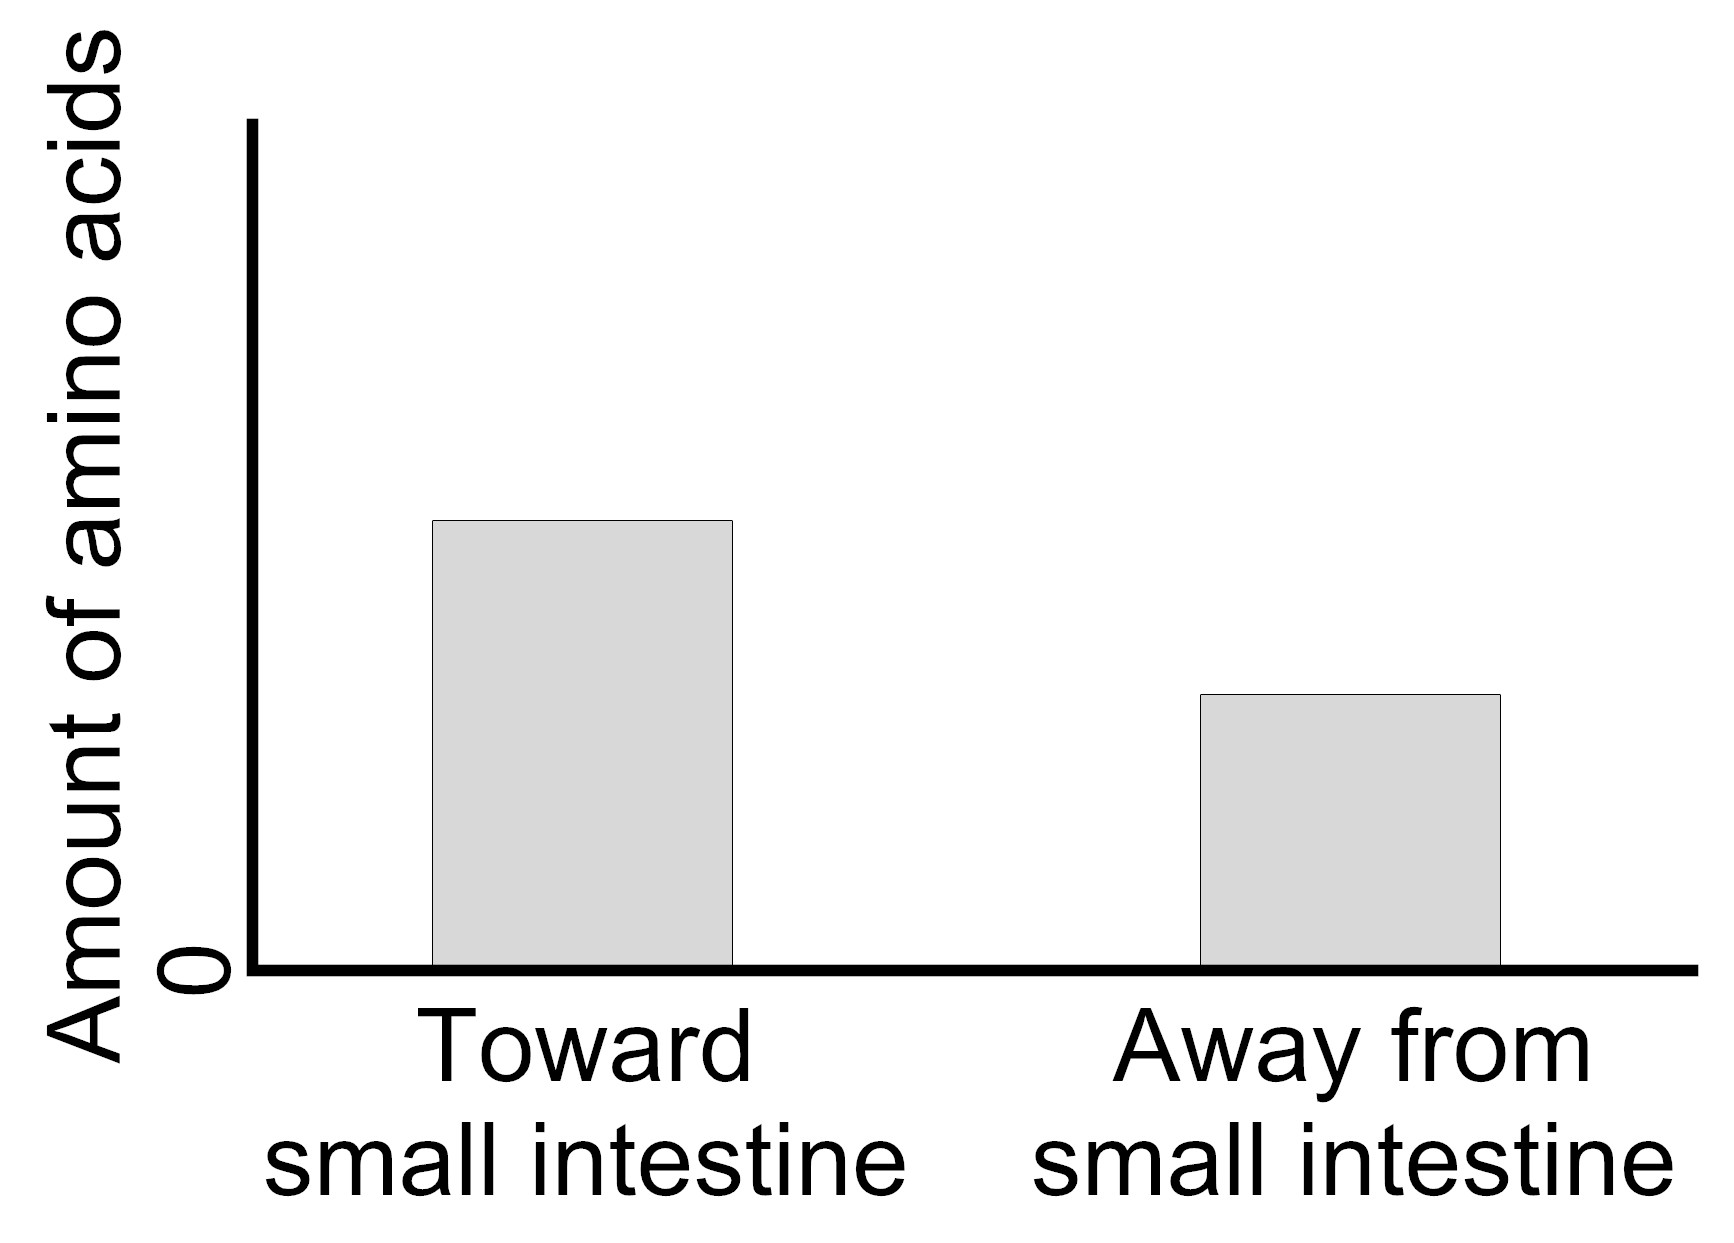
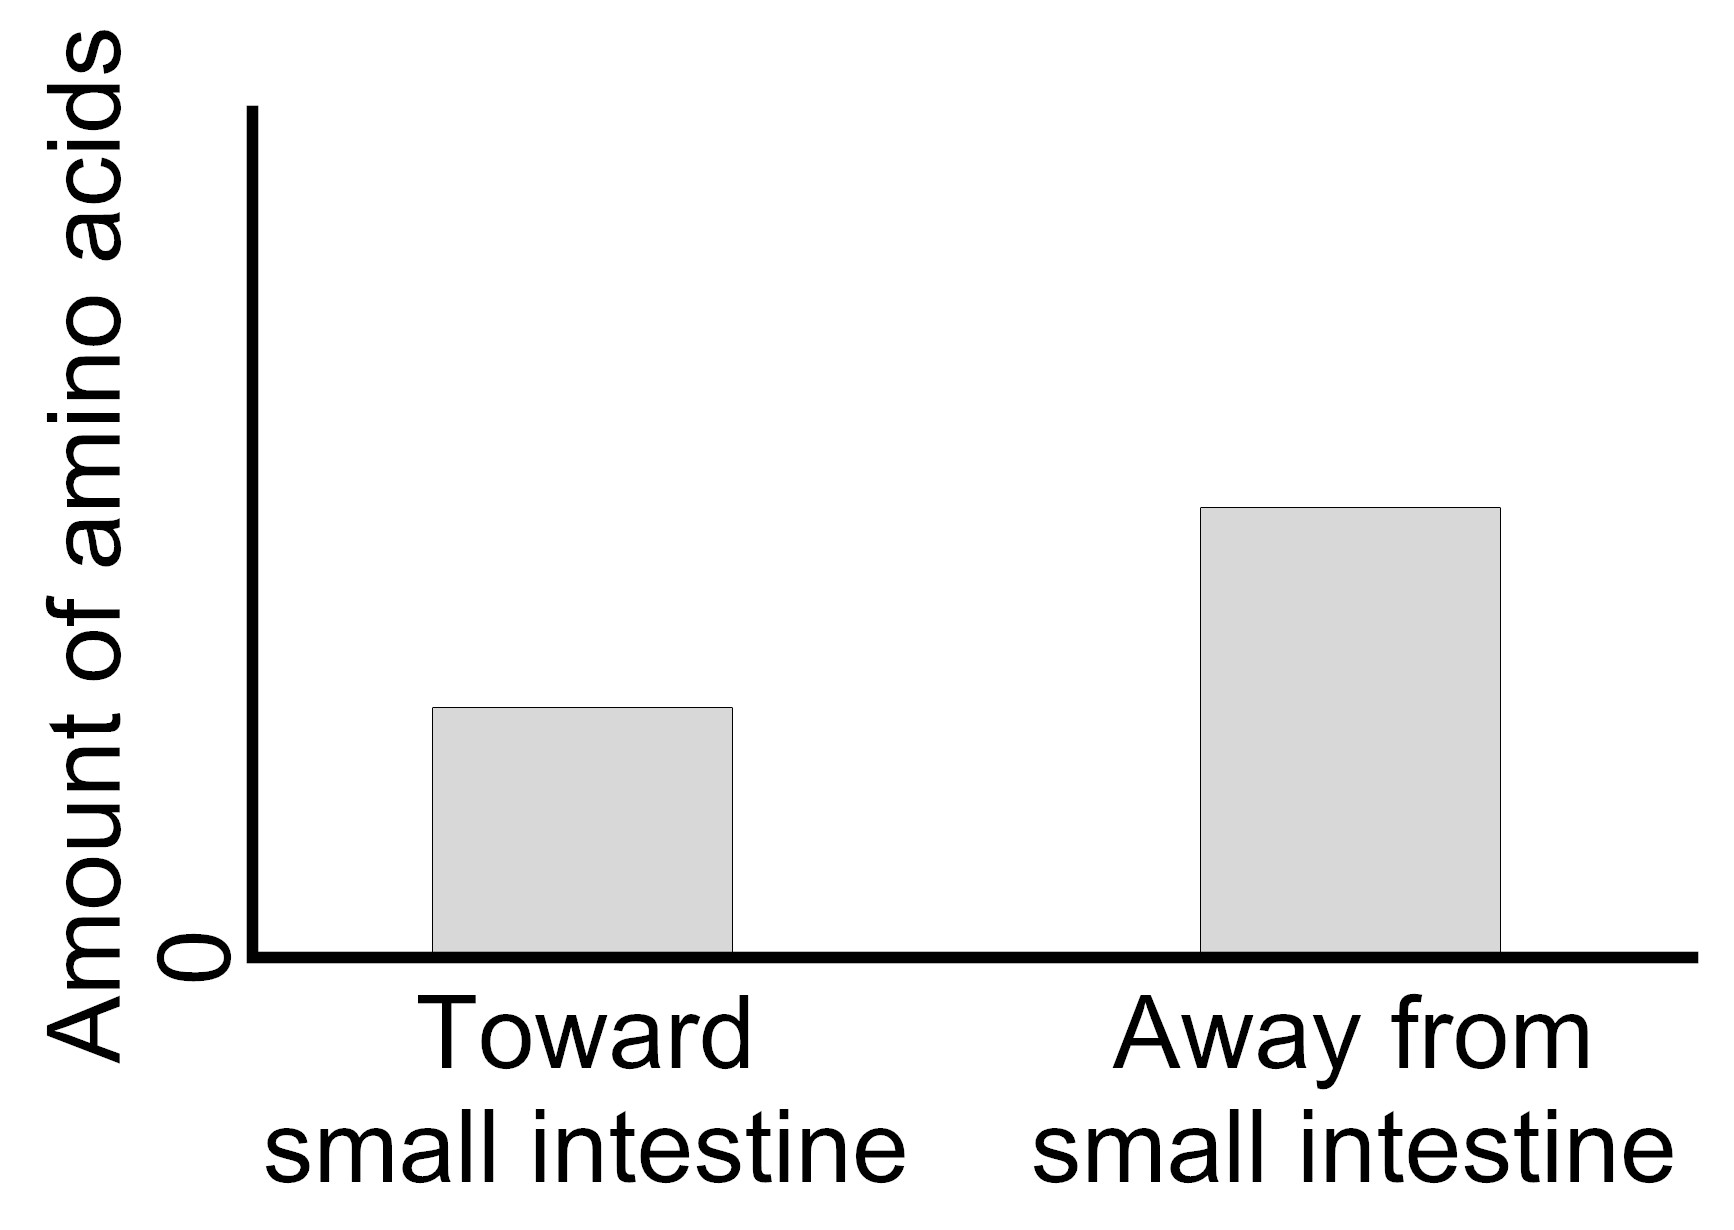
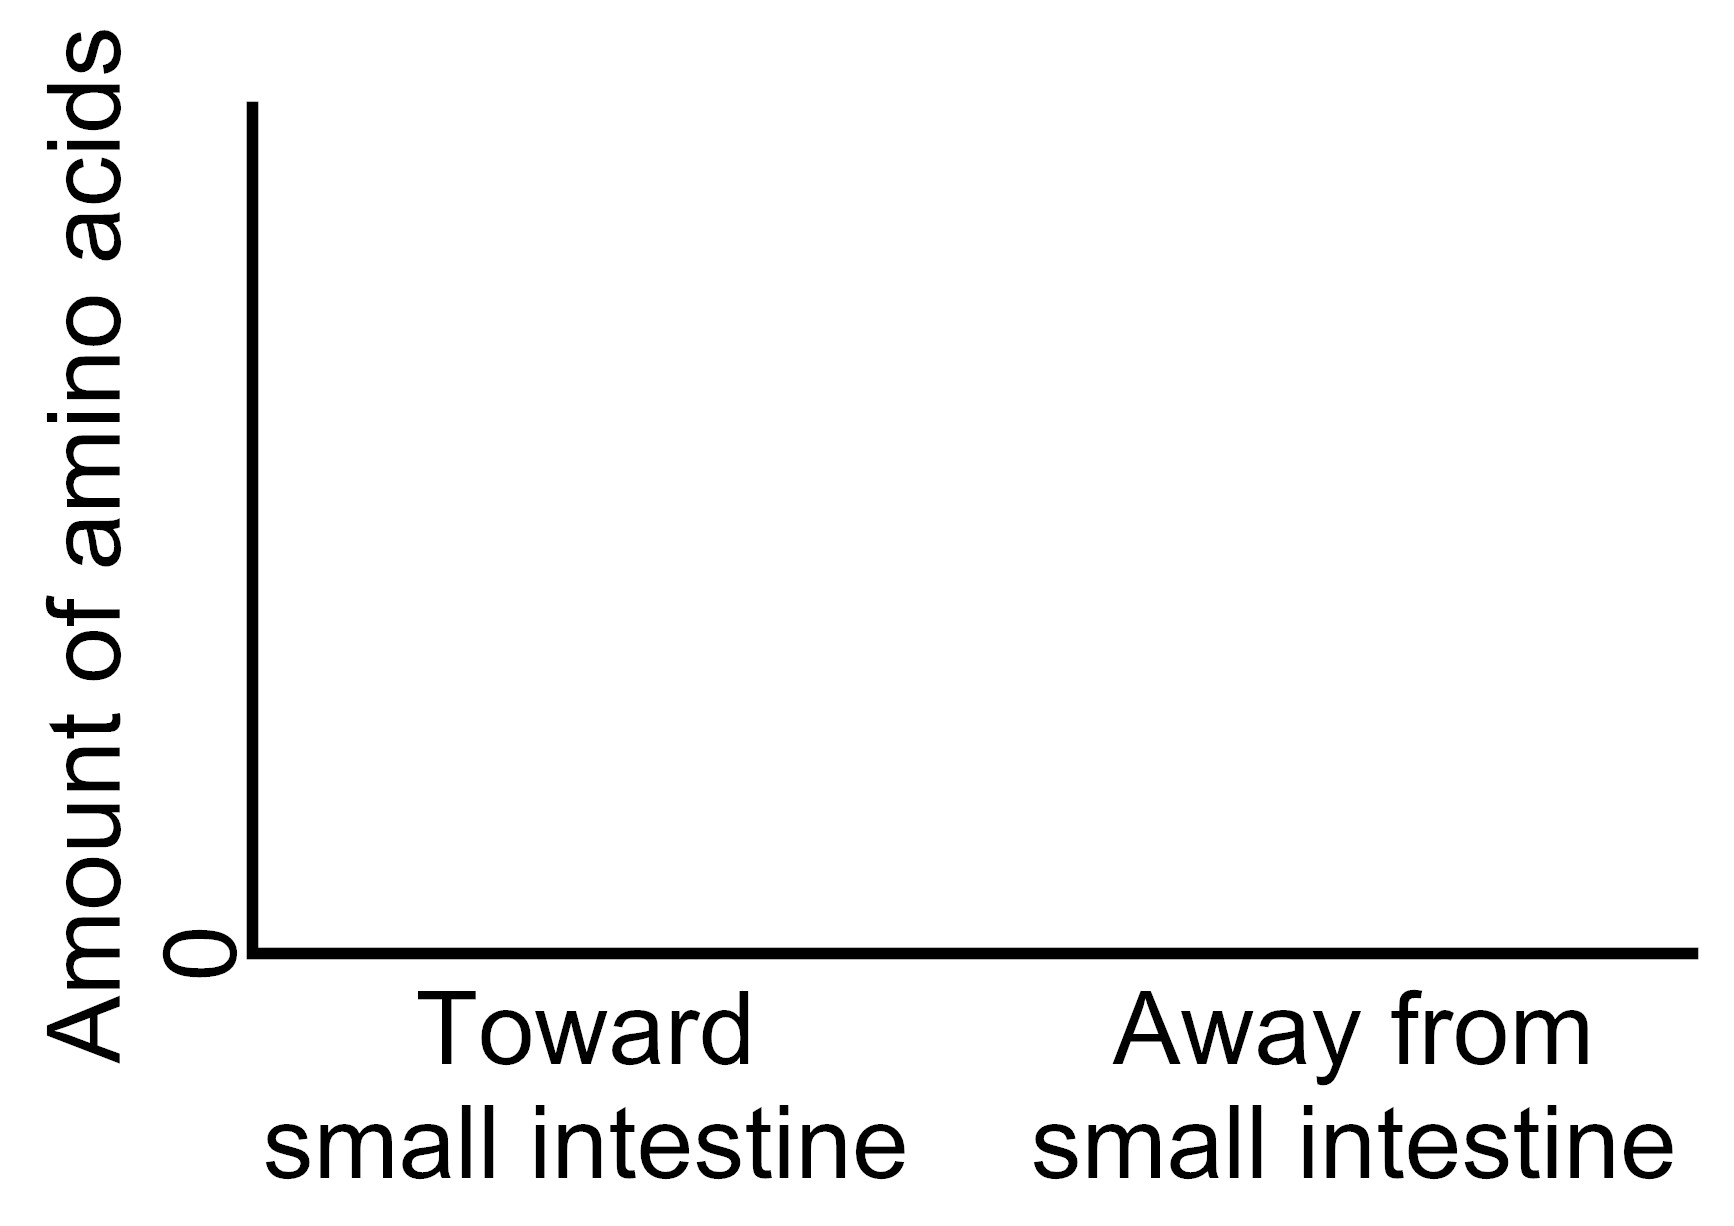
Item EB073001: After eating a meal that is high in protein, the level of amino acids in blood vessels flowing toward the small intestine is lower than in blood vessels flowing away from the small intestine.
Which of the following graphs represents the level of amino acids in the blood vessels flowing toward and the level of amino acids in the blood vessels flowing away from the small intestine after a person eats a meal that is high in protein?
Pre-Test
Answer Choice |
Overall |
Grades |
Gender |
Primary Language |
||||
|---|---|---|---|---|---|---|---|---|
| n = 440 |
6–8 n = 0 |
9–12 n = 386 |
Male n = 235 |
Female n = 154 |
English n = 364 |
Other n = 24 |
||
| A. |
 |
16% | NAN% | 16% | 17% | 15% | 15% | 25% |
| B. |
 |
48% | NAN% | 49% | 46% | 52% | 48% | 54% |
| C. |
 |
30% | NAN% | 30% | 32% | 25% | 30% | 21% |
| D. |
 |
6% | NAN% | 5% | 5% | 8% | 6% | 0% |
Post-Test
Answer Choice |
Overall |
Grades |
Gender |
Primary Language |
||||
|---|---|---|---|---|---|---|---|---|
| n = 483 |
6–8 n = 0 |
9–12 n = 443 |
Male n = 253 |
Female n = 181 |
English n = 410 |
Other n = 26 |
||
| A. |
 |
10% | NAN% | 11% | 12% | 9% | 10% | 12% |
| B. |
 |
51% | NAN% | 52% | 49% | 52% | 52% | 54% |
| C. |
 |
35% | NAN% | 34% | 34% | 36% | 34% | 31% |
| D. |
 |
4% | NAN% | 4% | 5% | 2% | 4% | 4% |

