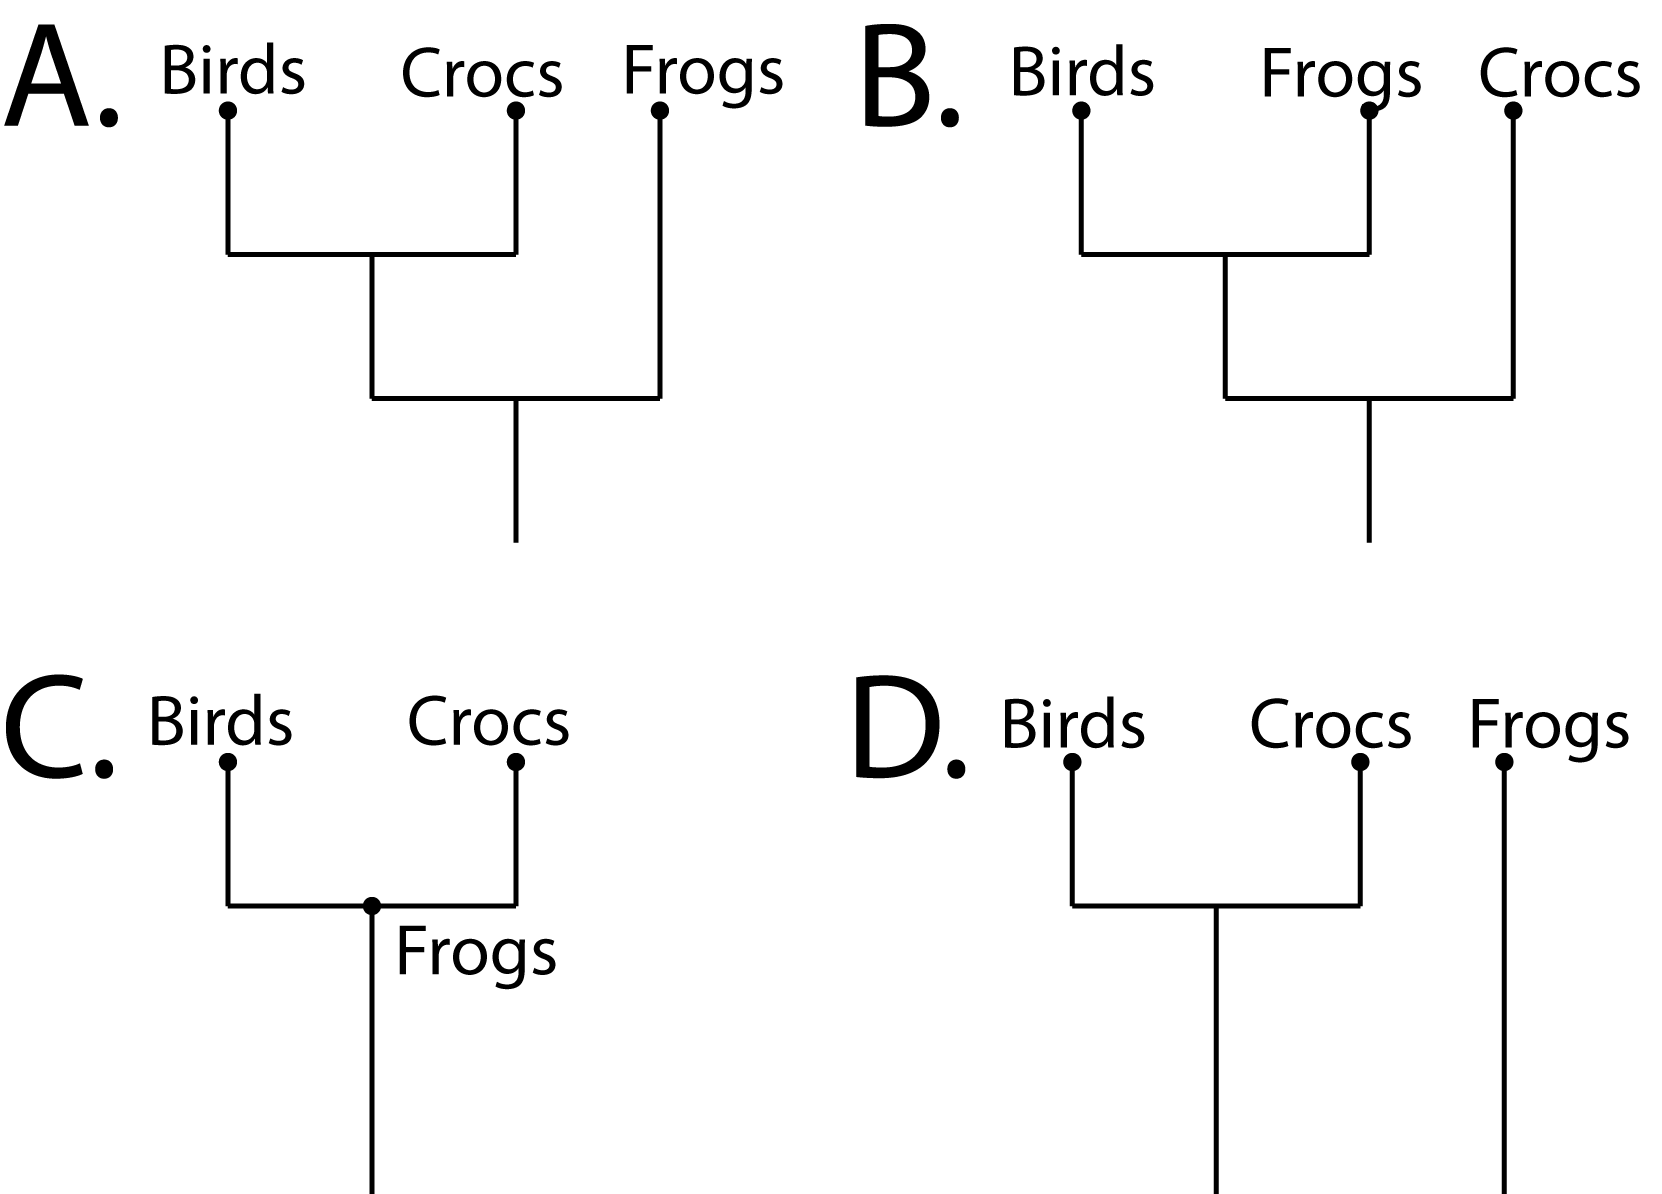
Item CA020003: Organisms that have more traits in common share a more recent common ancestor than organisms with fewer traits in common. (Tree diagram)
The table below shows the presence or absence of traits in seven different species.
|
Character |
Frog |
Bird |
Crocodiles |
Whale |
Pig |
Gorilla |
|
Blowhole |
|
|
|
Yes |
|
|
|
Body hair |
|
|
|
Yes |
Yes |
Yes |
|
Amniotic egg |
|
Yes |
Yes |
Yes |
Yes |
Yes |
|
Forelimbs |
Yes |
Yes |
Yes |
Yes |
Yes |
Yes |
|
Backbone |
Yes |
Yes |
Yes |
Yes |
Yes |
Yes |
|
Holes in Skull |
|
Yes |
Yes |
|
|
|
Which diagram most likely depicts the relationship between birds, crocodiles, and frogs? Choose the diagram which most likely depicts the relationship between birds, crocodiles, and frogs by clicking its letter at the bottom of the screen.

Pre-Test
Answer Choice |
Overall |
Grades |
Gender |
Primary Language |
|||
|---|---|---|---|---|---|---|---|
| n = 580 |
6–8 n = 25 |
9–12 n = 514 |
Male n = 254 |
Female n = 286 |
English n = 526 |
Other n = 13 |
|
| A. | 47% | 60% | 46% | 45% | 49% | 48% | 31% |
| B. | 20% | 4% | 20% | 24% | 15% | 19% | 15% |
| C. | 20% | 20% | 20% | 17% | 22% | 20% | 31% |
| D. | 14% | 16% | 13% | 13% | 13% | 13% | 23% |
Post-Test (Control)
Answer Choice |
Overall |
Grades |
Gender |
Primary Language |
|||
|---|---|---|---|---|---|---|---|
| n = 0 |
6–8 n = 0 |
9–12 n = 0 |
Male n = 0 |
Female n = 0 |
English n = 0 |
Other n = 0 |
|
| A. | NAN% | NAN% | NAN% | NAN% | NAN% | NAN% | NAN% |
| B. | NAN% | NAN% | NAN% | NAN% | NAN% | NAN% | NAN% |
| C. | NAN% | NAN% | NAN% | NAN% | NAN% | NAN% | NAN% |
| D. | NAN% | NAN% | NAN% | NAN% | NAN% | NAN% | NAN% |
Post-Test (Treatment)
Answer Choice |
Overall |
Grades |
Gender |
Primary Language |
|||
|---|---|---|---|---|---|---|---|
| n = 0 |
6–8 n = 0 |
9–12 n = 0 |
Male n = 0 |
Female n = 0 |
English n = 0 |
Other n = 0 |
|
| A. | NAN% | NAN% | NAN% | NAN% | NAN% | NAN% | NAN% |
| B. | NAN% | NAN% | NAN% | NAN% | NAN% | NAN% | NAN% |
| C. | NAN% | NAN% | NAN% | NAN% | NAN% | NAN% | NAN% |
| D. | NAN% | NAN% | NAN% | NAN% | NAN% | NAN% | NAN% |

