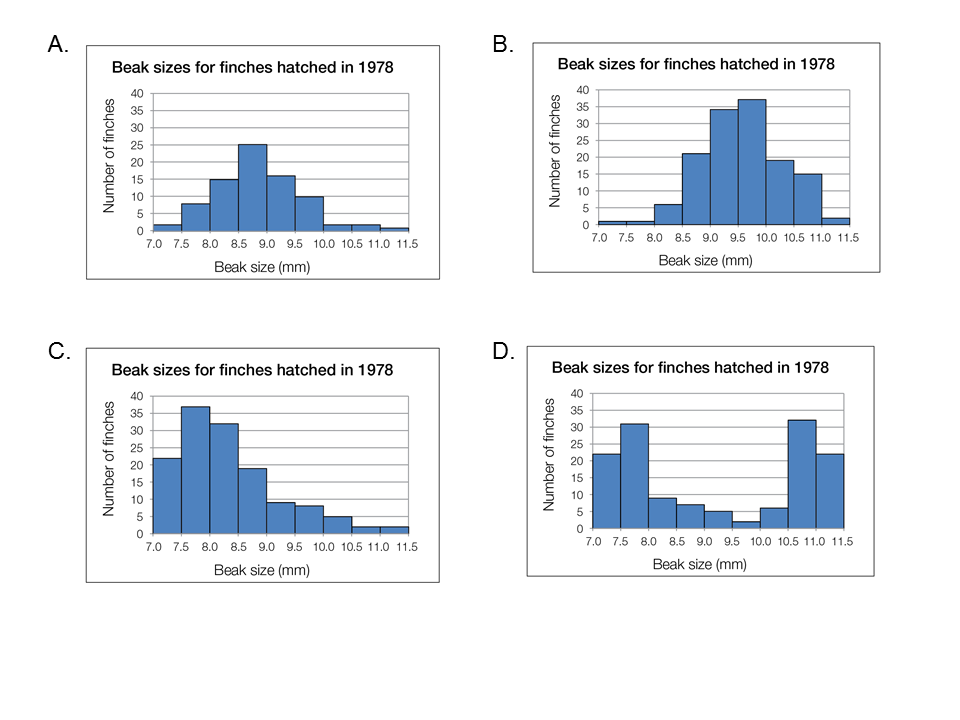
Item EM031007: If the environment changes so that only large seeds are available to a population of finches, over time the average beak size of the finches will increase.
The ground finch (Geospiza fortis) is a species of bird. To learn more about the kinds of foods the finches could eat, scientists observed the finches and measured the size of their beaks. The graph below shows the beak size (in millimeters) of a sample of ground finch recorded in 1976.

Left: An individual female ground finch. Middle: A drawing showing the part of the finches’ beaks that the scientists were measuring. Right: Graph showing beak size (in millimeters) of a sample of ground finches.
Seeds are the finches’ main source of food. Finches with small beaks can eat only small seeds, but finches with large beaks can eat both small and large seeds. Beak size is inherited.
Imagine that a drought (a long period without rain) killed most of the plants that make small seeds. Except for the small seeds being gone, nothing else changed about the environment.
What do you think will happen to beak size in the next generation of finches? Choose the graph that best matches your prediction by clicking its corresponding letter at the bottom of the screen.

- Distribution of Responses

- Points Earned
| Group | Correct | Total | Percent |
|---|---|---|---|
| Overall | N/A | N/A | N/A |
| Grades | |||
| 6–8 | N/A | N/A | N/A |
| 9–12 | N/A | N/A | N/A |
| Gender | |||
| Male | N/A | N/A | N/A |
| Female | N/A | N/A | N/A |
| Primary Language | |||
| English | N/A | N/A | N/A |
| Other | N/A | N/A | N/A |
- Distribution of Responses

- Points Earned
| Group | Correct | Total | Percent |
|---|---|---|---|
| Overall | 165 | 255 | 65% |
| Grades | |||
| 6–8 | 5 | 15 | 33% |
| 9–12 | 129 | 195 | 66% |
| Gender | |||
| Male | 60 | 97 | 62% |
| Female | 80 | 119 | 67% |
| Primary Language | |||
| English | 134 | 205 | 65% |
| Other | 2 | 6 | 33% |
- Distribution of Responses

- Points Earned
| Group | Correct | Total | Percent |
|---|---|---|---|
| Overall | 222 | 301 | 74% |
| Grades | |||
| 6–8 | 7 | 8 | 88% |
| 9–12 | 203 | 274 | 74% |
| Gender | |||
| Male | 98 | 134 | 73% |
| Female | 110 | 150 | 73% |
| Primary Language | |||
| English | 204 | 274 | 74% |
| Other | 7 | 9 | 78% |
- Science and Engineering Practices
- SEP4 Represent data in tables and/or various graphical displays (bar graphs, pictographs and/or pie charts) to reveal patterns that indicate relationships.
- Disciplinary Core Ideas
- LS4.C Adaptation by natural selection acting over generations is one important process by which species change over time in response to changes in environmental conditions. Traits that support successful survival and reproduction in the new environment become more common; those that do not become less common. Thus, the distribution of traits in a population changes.

