Evolution
![]() Evolution and Natural Selection
Evolution and Natural Selection
![]() There are similarities and differences between organisms living today, and between organisms living today and th…
There are similarities and differences between organisms living today, and between organisms living today and th…
Item EM001006: Ear length varies within a population of rabbits. (Recognize a statement that describes the variability shown in a bar graph.)

The graph below shows the ear lengths of a population of rabbits.
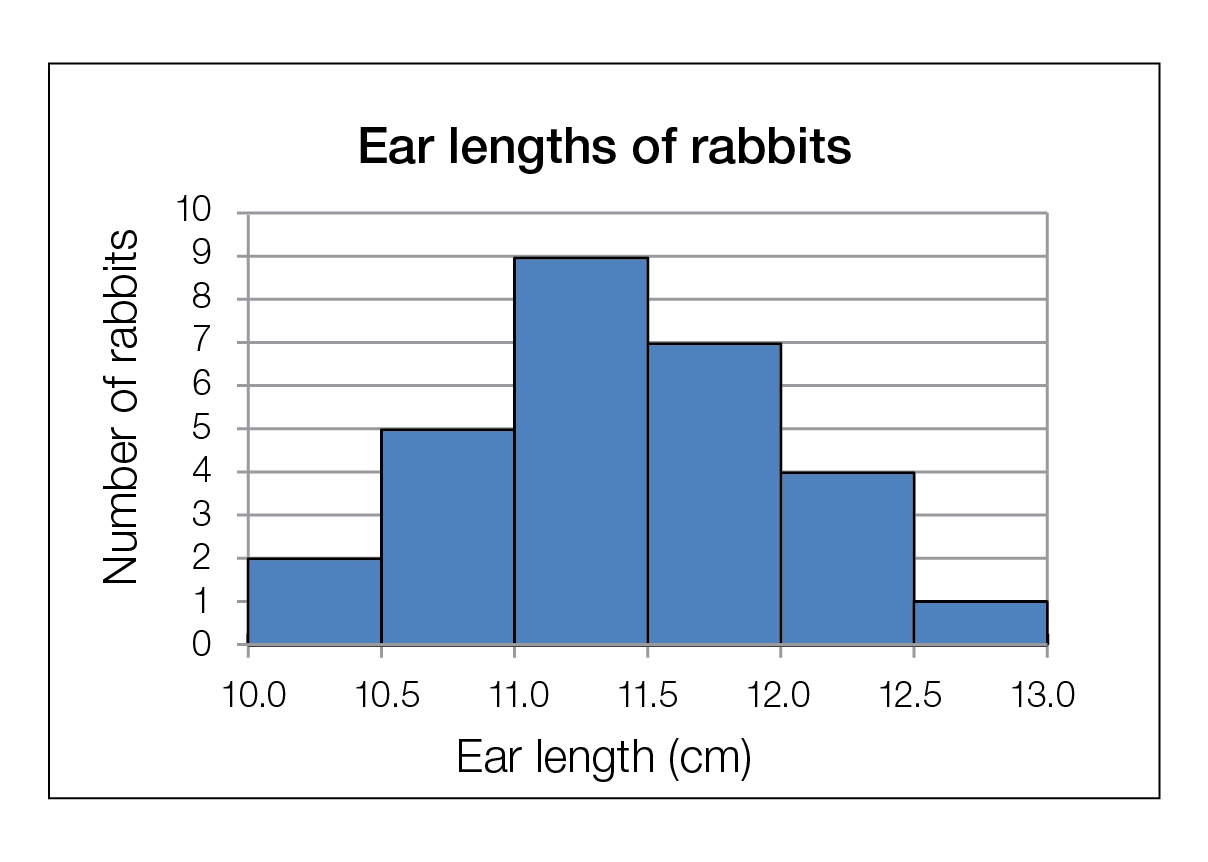
Which of the following claims about the population do the data in this graph support?
- Ear length is changing over time in the population.
- Ear length is undergoing natural selection in the population.
- Ear length is the same throughout the population.
- Ear length varies among individuals in the population.
- Distribution of Responses

- Points Earned
| Group | Correct | Total | Percent |
|---|---|---|---|
| Overall | 328 | 572 | 57% |
| Grades | |||
| 6–8 | 14 | 18 | 78% |
| 9–12 | 286 | 502 | 57% |
| Gender | |||
| Male | 145 | 245 | 59% |
| Female | 160 | 283 | 57% |
| Primary Language | |||
| English | 293 | 511 | 57% |
| Other | 10 | 18 | 56% |
- Distribution of Responses

- Points Earned
| Group | Correct | Total | Percent |
|---|---|---|---|
| Overall | 143 | 274 | 52% |
| Grades | |||
| 6–8 | 6 | 14 | 43% |
| 9–12 | 125 | 230 | 54% |
| Gender | |||
| Male | 60 | 119 | 50% |
| Female | 69 | 130 | 53% |
| Primary Language | |||
| English | 127 | 237 | 54% |
| Other | 3 | 9 | 33% |
- Distribution of Responses

- Points Earned
| Group | Correct | Total | Percent |
|---|---|---|---|
| Overall | 185 | 278 | 67% |
| Grades | |||
| 6–8 | 3 | 4 | 75% |
| 9–12 | 166 | 248 | 67% |
| Gender | |||
| Male | 89 | 130 | 68% |
| Female | 87 | 131 | 66% |
| Primary Language | |||
| English | 168 | 251 | 67% |
| Other | 3 | 5 | 60% |
- Science and Engineering Practices
- SEP4 Analyze and interpret data to provide evidence for phenomena.
- Disciplinary Core Ideas
- LS3.B Individuals of the same kind of plant or animal are recognizable as similar but can also vary in many ways.