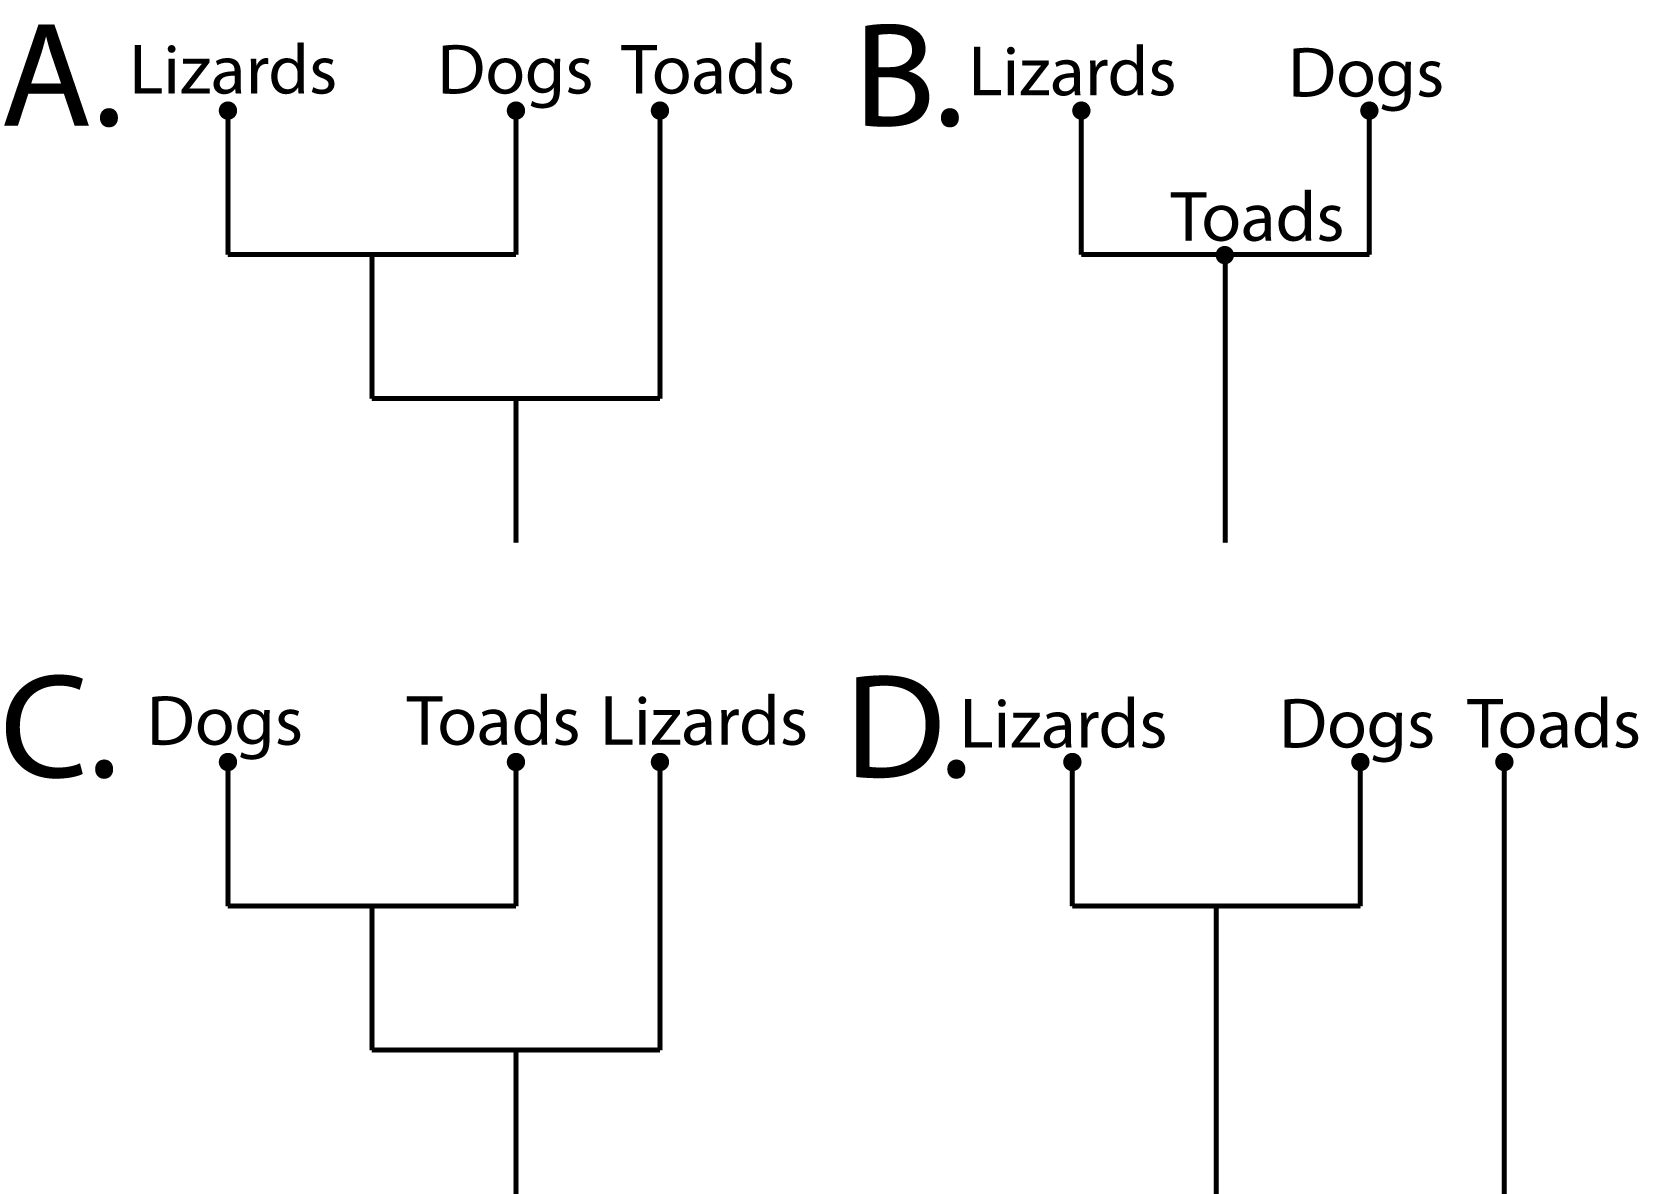
Item CA012001: Identify the diagram that most likely depicts the ancestry of lizards, toads, and dogs if the DNA of lizards and dogs is more similar than the DNA of lizards and toads.
If the DNA of lizards and dogs is more similar than the DNA of lizards and toads, which diagram most likely depicts the ancestry of these three groups?
Choose the diagram which most likely depicts the ancestry of these three groups by clicking its letter at the bottom of the screen.

Pre-Test
Answer Choice |
Overall |
Grades |
Gender |
Primary Language |
|||
|---|---|---|---|---|---|---|---|
| n = 572 |
6–8 n = 18 |
9–12 n = 502 |
Male n = 245 |
Female n = 283 |
English n = 511 |
Other n = 18 |
|
| A. | 54% | 56% | 53% | 51% | 57% | 54% | 50% |
| B. | 14% | 11% | 14% | 15% | 12% | 14% | 11% |
| C. | 18% | 22% | 18% | 17% | 18% | 18% | 11% |
| D. | 15% | 11% | 15% | 18% | 13% | 14% | 28% |
Post-Test (Control)
Answer Choice |
Overall |
Grades |
Gender |
Primary Language |
|||
|---|---|---|---|---|---|---|---|
| n = 274 |
6–8 n = 14 |
9–12 n = 230 |
Male n = 119 |
Female n = 130 |
English n = 237 |
Other n = 9 |
|
| A. | 69% | 79% | 70% | 63% | 76% | 71% | 56% |
| B. | 8% | 7% | 8% | 13% | 3% | 8% | 11% |
| C. | 13% | 14% | 12% | 12% | 12% | 11% | 11% |
| D. | 10% | 0% | 10% | 12% | 9% | 9% | 22% |
Post-Test (Treatment)
Answer Choice |
Overall |
Grades |
Gender |
Primary Language |
|||
|---|---|---|---|---|---|---|---|
| n = 278 |
6–8 n = 4 |
9–12 n = 248 |
Male n = 130 |
Female n = 131 |
English n = 251 |
Other n = 5 |
|
| A. | 78% | 75% | 77% | 78% | 79% | 78% | 20% |
| B. | 6% | 0% | 7% | 8% | 5% | 7% | 20% |
| C. | 11% | 25% | 11% | 10% | 11% | 10% | 60% |
| D. | 4% | 0% | 4% | 4% | 5% | 5% | 0% |

