Evolution
![]() Argumentation and Evolution
Argumentation and Evolution
![]() In a scientific argument, claims about the natural world should be supported or refuted by evidence, and by reas…
In a scientific argument, claims about the natural world should be supported or refuted by evidence, and by reas…
Item EN100001: Use evidence provided in graphs and sound reasoning to explain if the process of natural selection caused the change in the leg-length ratio of anoles and their offspring born in two different environments.

Anoles are lizards that live in the southeastern United States, South America, and the Caribbean islands. Different anoles vary from each other in many ways. One trait on which anoles vary is their hind-leg length ratio. The hind-leg length ratio is the hind-leg length divided by the body length.
The images below show an anole and an X-ray image showing how scientists measure leg length (red line) and body length (blue line). They use these measurements to calculate the anole’s leg-length ratio. Anoles that have smaller leg-length ratios are better at running on thin branches and anoles that have larger leg-length ratios are better at running on thick branches.
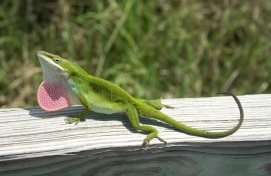
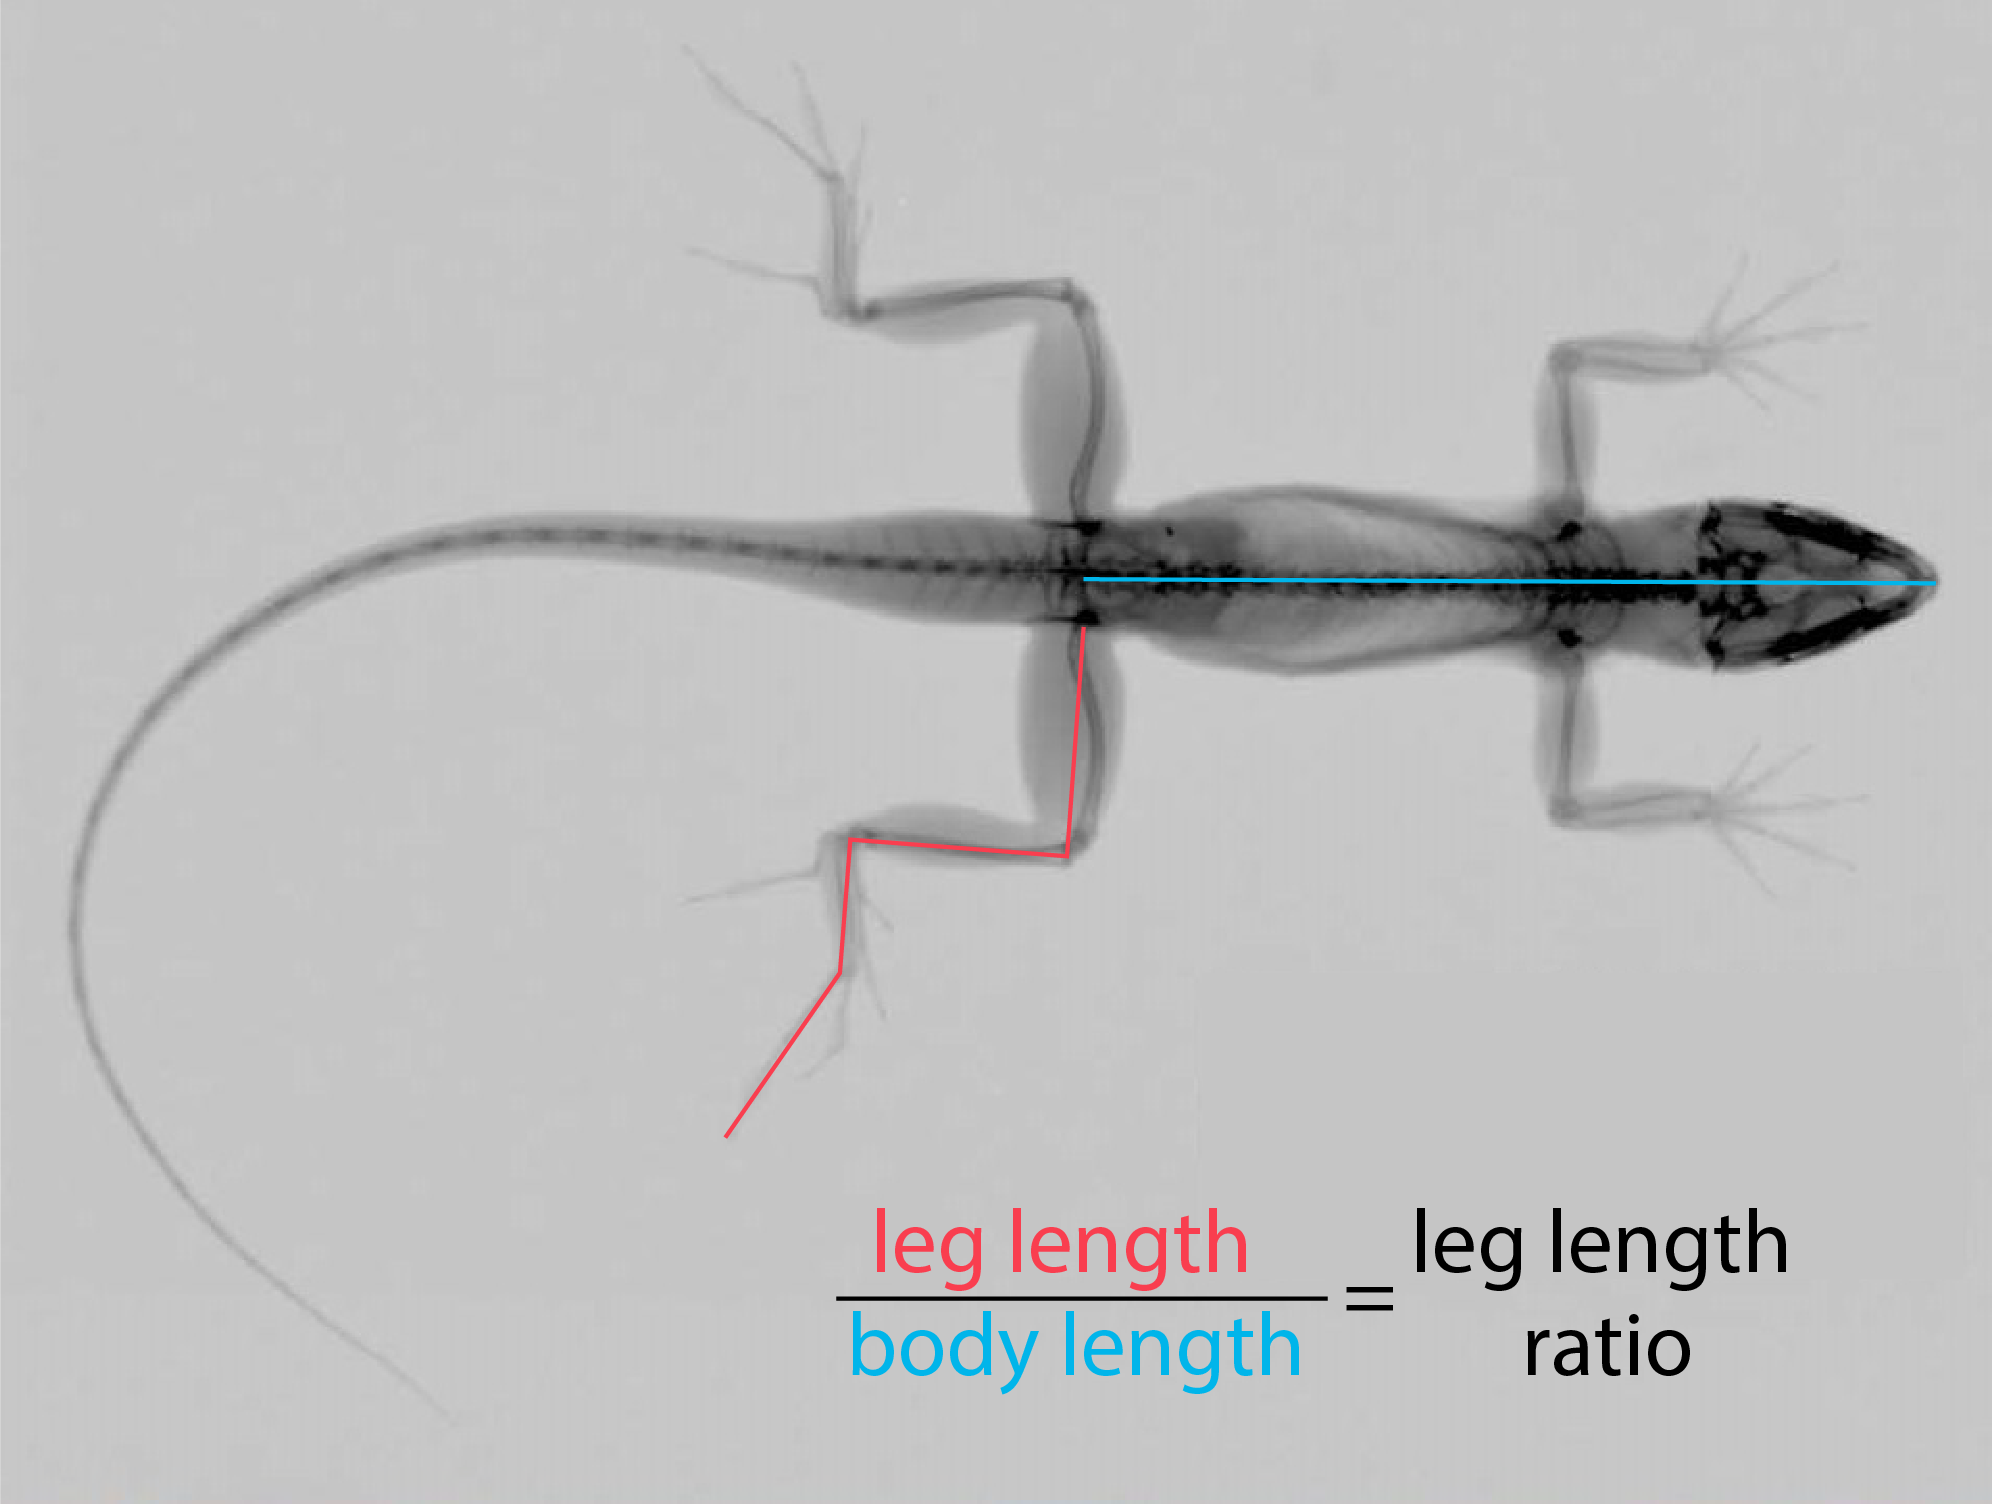
Left Image: Photograph of an Anole (Photo by Kristin Winchell.) Right Image: X-ray image showing how the leg-length ratio is calculated.
Adult hind-leg length ratio is a heritable trait. Scientists decided to test whether the leg-length ratio is a trait that undergoes evolution by natural selection. To do this they placed a group of anoles on small islands where there are only bushes with thin branches (no trees) and no other anoles. They called this the experimental habitat.
Each year, the scientists returned to the experimental habitat to measure the leg-length ratio of individuals from each generation of anole lizards. The graphs below show the leg-length ratios of anoles born in their natural habitat and the leg-length ratio of the third generation of anoles born in the experimental habitat.
Left Image: Distribution of Leg-length ratio in Anoles born in the natural habitat. Right Image: Distribution of Leg-length ratio in the third generation of Anoles born in the experimental habitat.
Do you think the process of natural selection caused the change in the leg-length ratio between anoles born in the natural habitat and the third generation of anoles born in the experimental habitat?
Write your answer in the form of an argument. Your argument should include: A claim that answers the question, evidence in the form of specific scientific data that supports your claim, and reasoning that uses appropriate scientific principles and justifies why the data counts as evidence for your claim.
- Distribution of Points Earned

- Points Earned
| Group | Earned | Possible | Percent |
|---|---|---|---|
| Overall | N/A | N/A | N/A |
| Grades | |||
| 6–8 | N/A | N/A | N/A |
| 9–12 | N/A | N/A | N/A |
| Gender | |||
| Male | N/A | N/A | N/A |
| Female | N/A | N/A | N/A |
| Primary Language | |||
| English | N/A | N/A | N/A |
| Other | N/A | N/A | N/A |
- Distribution of Points Earned

- Points Earned
| Group | Earned | Possible | Percent |
|---|---|---|---|
| Overall | 2796 | 9936 | 28% |
| Grades | |||
| 6–8 | 128 | 630 | 20% |
| 9–12 | 2275 | 8109 | 28% |
| Gender | |||
| Male | 967 | 3906 | 25% |
| Female | 1524 | 4995 | 31% |
| Primary Language | |||
| English | 2385 | 8541 | 28% |
| Other | 61 | 297 | 21% |
- Distribution of Points Earned

- Points Earned
| Group | Earned | Possible | Percent |
|---|---|---|---|
| Overall | 3624 | 10485 | 35% |
| Grades | |||
| 6–8 | 53 | 162 | 33% |
| 9–12 | 3268 | 9531 | 34% |
| Gender | |||
| Male | 1445 | 4815 | 30% |
| Female | 1989 | 5139 | 39% |
| Primary Language | |||
| English | 3268 | 9495 | 34% |
| Other | 76 | 297 | 26% |