Item EN064004: Write an argument to support the claim that natural selection is occurring in a population of finches based on data presented in a graph.
The ground finch is a species of bird. Seeds are the finches’ main source of food. Finches with small beaks can eat only small seeds, but finches with large beaks can eat both small and large seeds. Beak size is inherited.
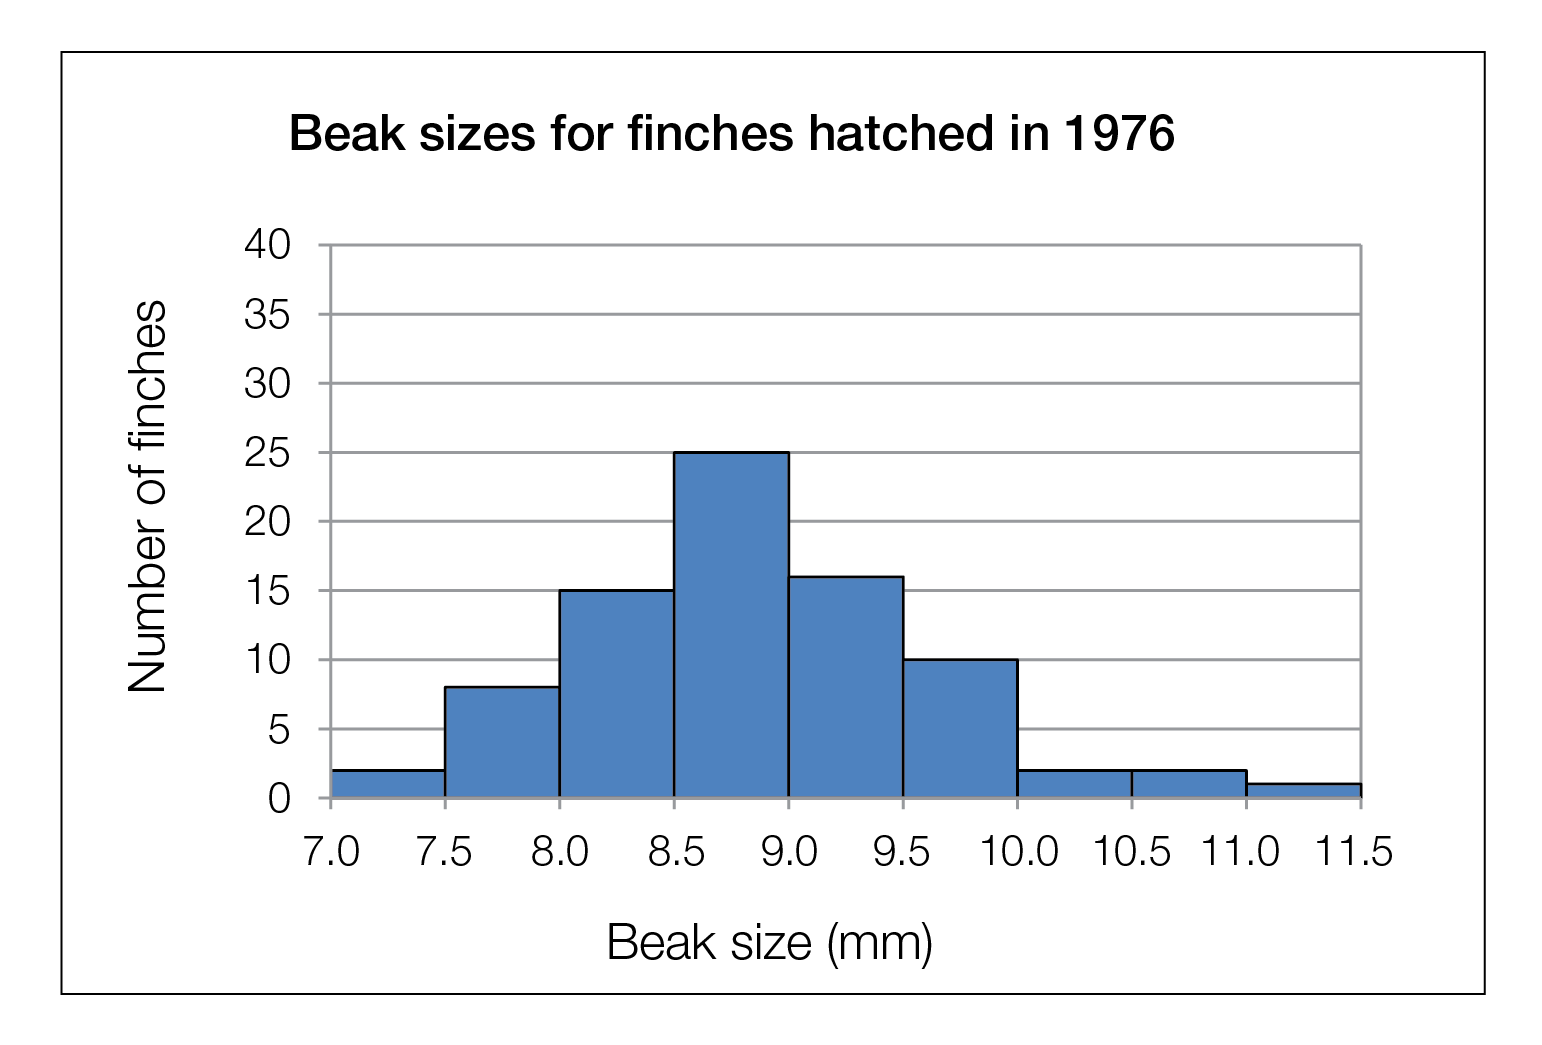
In 1976 scientists collected data on the size of the beaks of a population of finches that hatched that year. The graph below shows the beak size (in millimeters) of the 1976 sample.


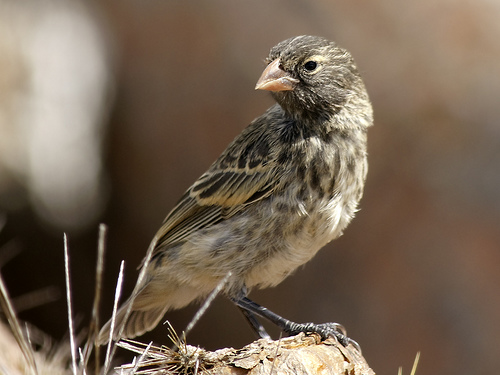
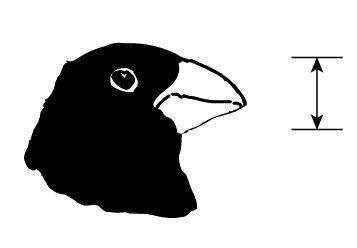
Left: An individual female ground finch. Middle: A drawing showing the part of the finches’ beaks that the scientists were measuring. Right: Graph showing beak size (in millimeters) of ground finches hatched in 1976.
In 1977, during a long period without rain many plants that produced small seeds died.
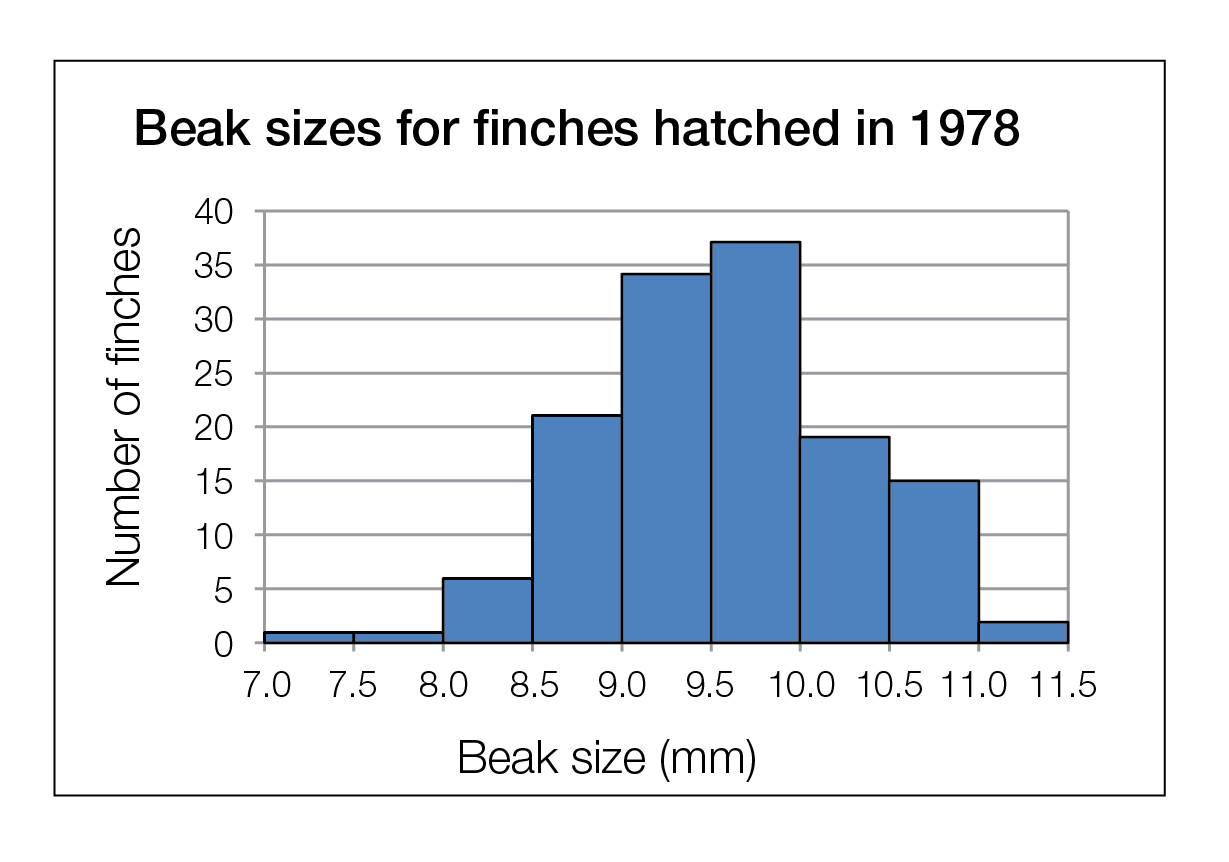
To learn how this influenced the next generation of finches; scientists returned in 1978 and measured the beak size of finches that hatched that year. The graph below shows the beak size (in millimeters) of the 1978 sample.

Graph showing beak size (in millimeters) of ground finches that hatched in 1978.
Do you think the process of natural selection caused the changes in the finch populations between 1976 and 1978?
Write your answer in the form of an argument. Your argument should include: A claim that answers the question, evidence in the form of specific scientific data that supports your claim, and reasoning that uses appropriate scientific principles and justifies why the data counts as evidence for your claim.
- Distribution of Points Earned

- Points Earned
| Group | Earned | Possible | Percent |
|---|---|---|---|
| Overall | 5460 | 20421 | 27% |
| Grades | |||
| 6–8 | 175 | 819 | 21% |
| 9–12 | 4825 | 18117 | 27% |
| Gender | |||
| Male | 2199 | 8667 | 25% |
| Female | 2874 | 10287 | 28% |
| Primary Language | |||
| English | 4900 | 18495 | 26% |
| Other | 131 | 567 | 23% |
- Distribution of Points Earned

- Points Earned
| Group | Earned | Possible | Percent |
|---|---|---|---|
| Overall | N/A | N/A | N/A |
| Grades | |||
| 6–8 | N/A | N/A | N/A |
| 9–12 | N/A | N/A | N/A |
| Gender | |||
| Male | N/A | N/A | N/A |
| Female | N/A | N/A | N/A |
| Primary Language | |||
| English | N/A | N/A | N/A |
| Other | N/A | N/A | N/A |
- Distribution of Points Earned

- Points Earned
| Group | Earned | Possible | Percent |
|---|---|---|---|
| Overall | N/A | N/A | N/A |
| Grades | |||
| 6–8 | N/A | N/A | N/A |
| 9–12 | N/A | N/A | N/A |
| Gender | |||
| Male | N/A | N/A | N/A |
| Female | N/A | N/A | N/A |
| Primary Language | |||
| English | N/A | N/A | N/A |
| Other | N/A | N/A | N/A |
- Disciplinary Core Ideas
- LS4.B Natural selection leads to the predominance of certain traits in a population, and the suppression of others.
LS4.C Adaptation by natural selection acting over generations is one important process by which species change over time in response to changes in environmental conditions. Traits that support successful survival and reproduction in the new environment become more common; those that do not become less common. Thus, the distribution of traits in a population changes.
LS4.C Natural selection leads to adaptation, that is, to a population dominated by organisms that are anatomically, behaviorally, and physiologically well suited to survive and reproduce in a specific environment. That is, the differential survival and reproduction of organisms in a population that have an advantageous heritable trait leads to an increase in the proportion of individuals in future generations that have the trait and to a decrease in the proportion of individuals that do not.


