Item EM001006: Ear length varies within a population of rabbits. (Recognize a statement that describes the variability shown in a bar graph.)

The graph below shows the ear lengths of a population of rabbits.
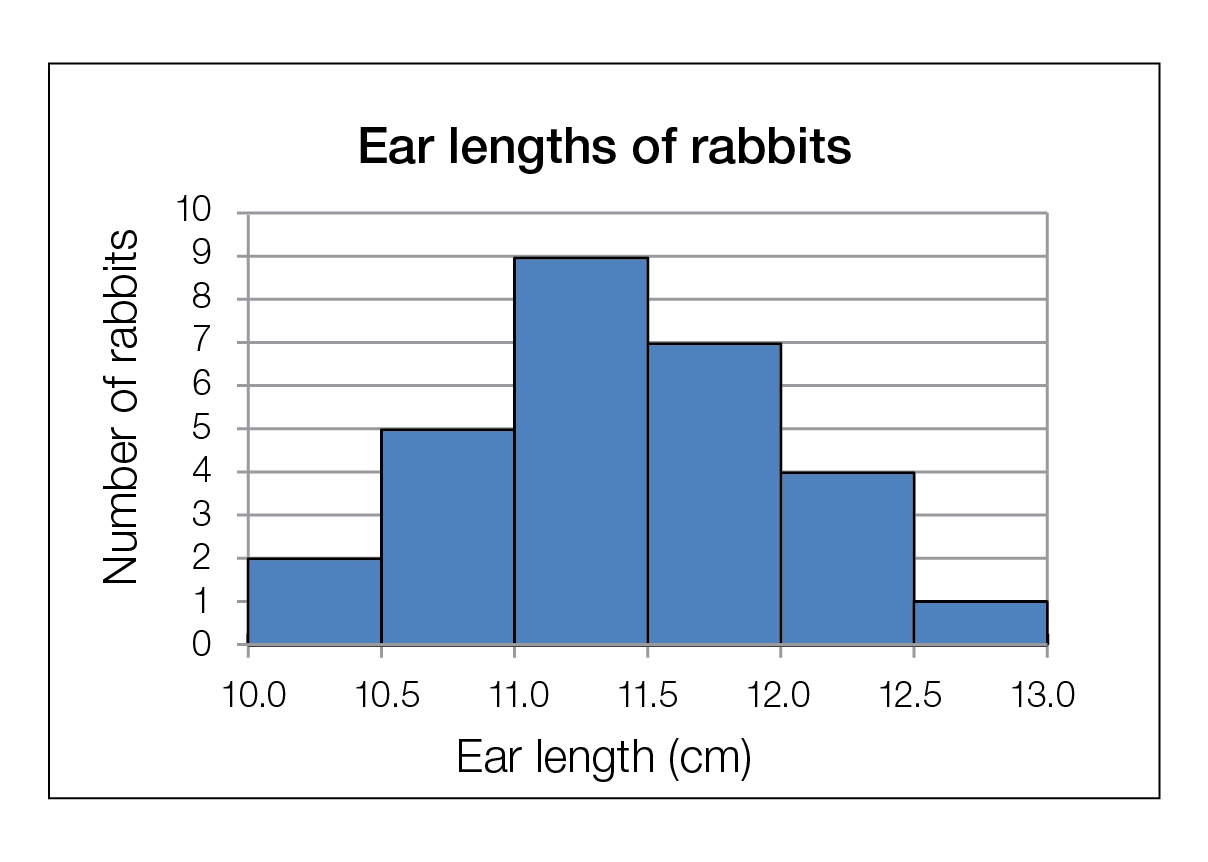
Which of the following claims about the population do the data in this graph support?
- Ear length is changing over time in the population.
- Ear length is undergoing natural selection in the population.
- Ear length is the same throughout the population.
- Ear length varies among individuals in the population.
- Distribution of Responses

- Points Earned
| Group | Correct | Total | Percent |
|---|---|---|---|
| Overall | 328 | 572 | 57% |
| Grades | |||
| 6–8 | 14 | 18 | 78% |
| 9–12 | 286 | 502 | 57% |
| Gender | |||
| Male | 145 | 245 | 59% |
| Female | 160 | 283 | 57% |
| Primary Language | |||
| English | 293 | 511 | 57% |
| Other | 10 | 18 | 56% |
- Distribution of Responses

- Points Earned
| Group | Correct | Total | Percent |
|---|---|---|---|
| Overall | 143 | 274 | 52% |
| Grades | |||
| 6–8 | 6 | 14 | 43% |
| 9–12 | 125 | 230 | 54% |
| Gender | |||
| Male | 60 | 119 | 50% |
| Female | 69 | 130 | 53% |
| Primary Language | |||
| English | 127 | 237 | 54% |
| Other | 3 | 9 | 33% |
- Distribution of Responses

- Points Earned
| Group | Correct | Total | Percent |
|---|---|---|---|
| Overall | 185 | 278 | 67% |
| Grades | |||
| 6–8 | 3 | 4 | 75% |
| 9–12 | 166 | 248 | 67% |
| Gender | |||
| Male | 89 | 130 | 68% |
| Female | 87 | 131 | 66% |
| Primary Language | |||
| English | 168 | 251 | 67% |
| Other | 3 | 5 | 60% |
- Science and Engineering Practices
- SEP4 Analyze and interpret data to provide evidence for phenomena.
- Disciplinary Core Ideas
- LS3.B Individuals of the same kind of plant or animal are recognizable as similar but can also vary in many ways.