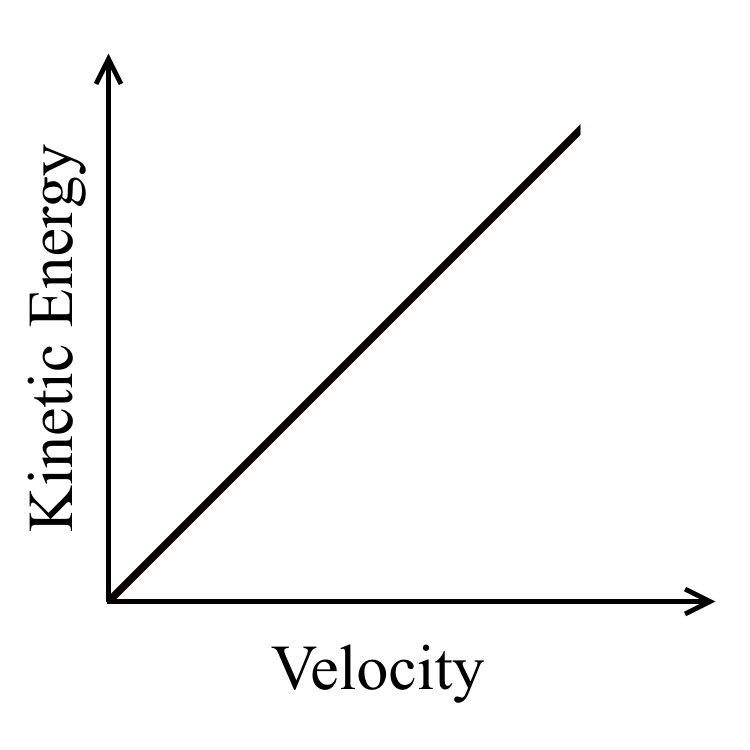
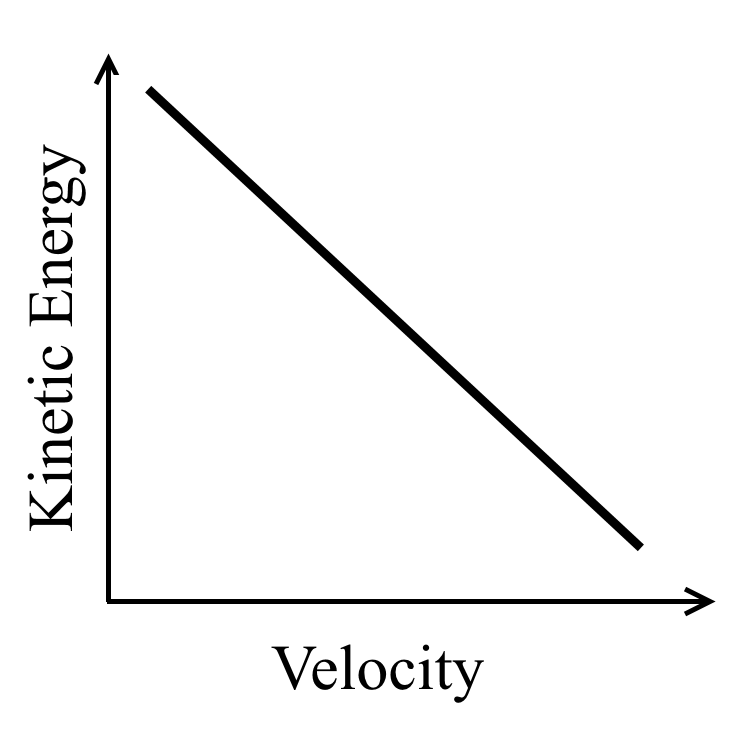
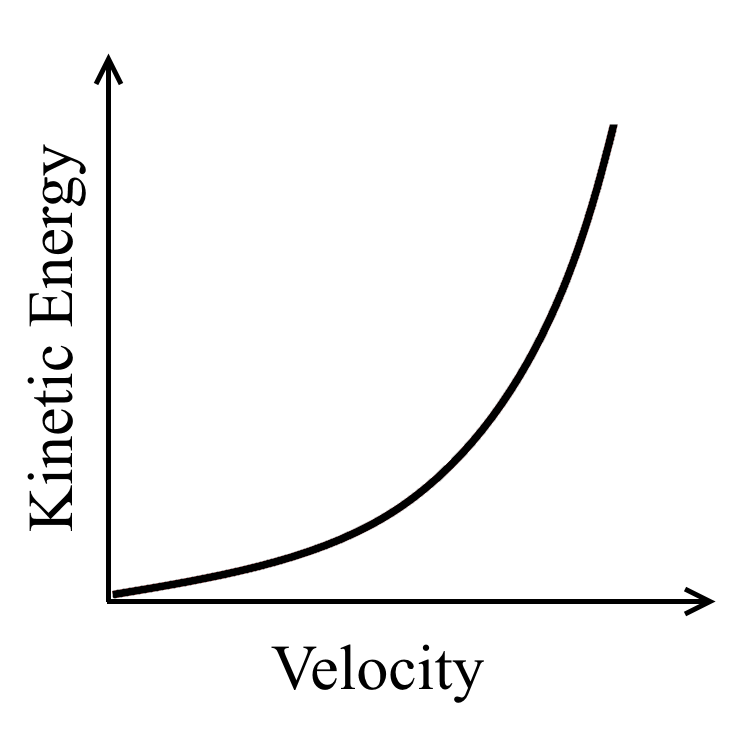
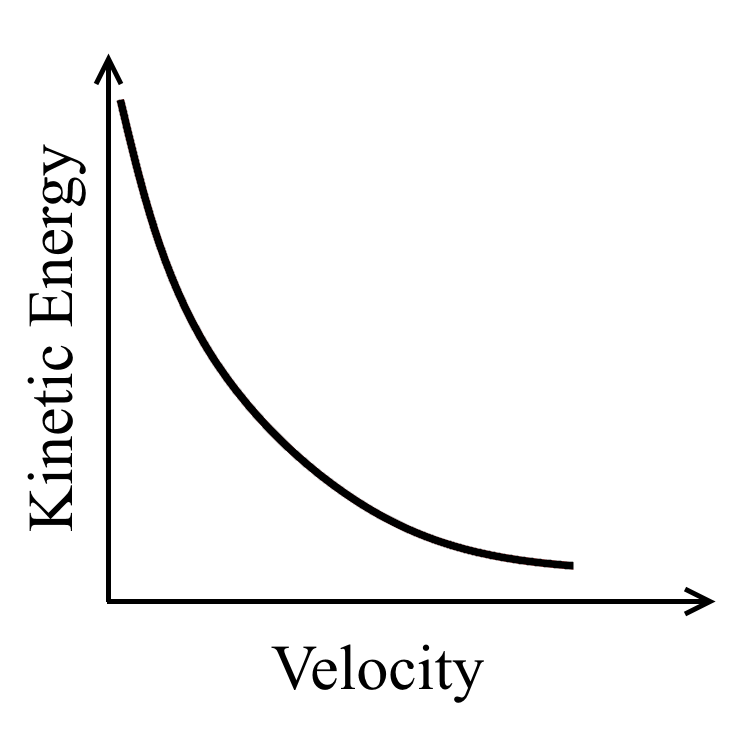
Item RG175001: Kinetic energy is proportional to the speed squared. (Item uses line graphs.)
A ball rolls down a ramp as pictured below. As it rolls down the ramp, its speed increases.
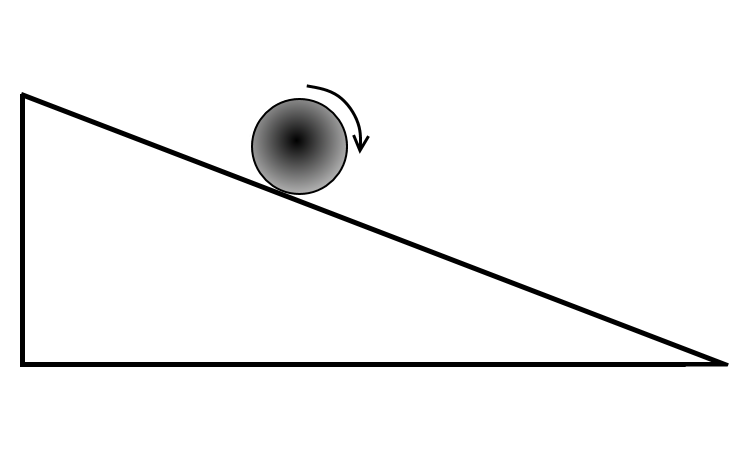
Which of the following graphs represents the kinetic energy (motion energy) of the ball as it rolls down the ramp?
Answer Choice |
Overall |
Grades |
Gender |
Primary Language |
||||
|---|---|---|---|---|---|---|---|---|
| n = 1522 |
4–5 n = 0 | 6–8 n = 774 |
9–12 n = 748 |
Male n = 729 |
Female n = 760 |
English n = 1367 |
Other n = 113 |
|
| A. | 35% | N/A | 31% | 39% | 32% | 38% | 35% | 37% |
| B. | 27% | N/A | 36% | 18% | 28% | 27% | 27% | 30% |
| C. | 27% | N/A | 21% | 34% | 29% | 26% | 28% | 21% |
| D. | 10% | N/A | 12% | 9% | 11% | 10% | 10% | 12% |


