Item NG089004: The total amount of energy in a lunch box containing only an ice pack and the air around it remains the same even after the ice pack gets warmer and the air gets colder. (This item uses bar graphs to depict the amounts of each form of energy.)
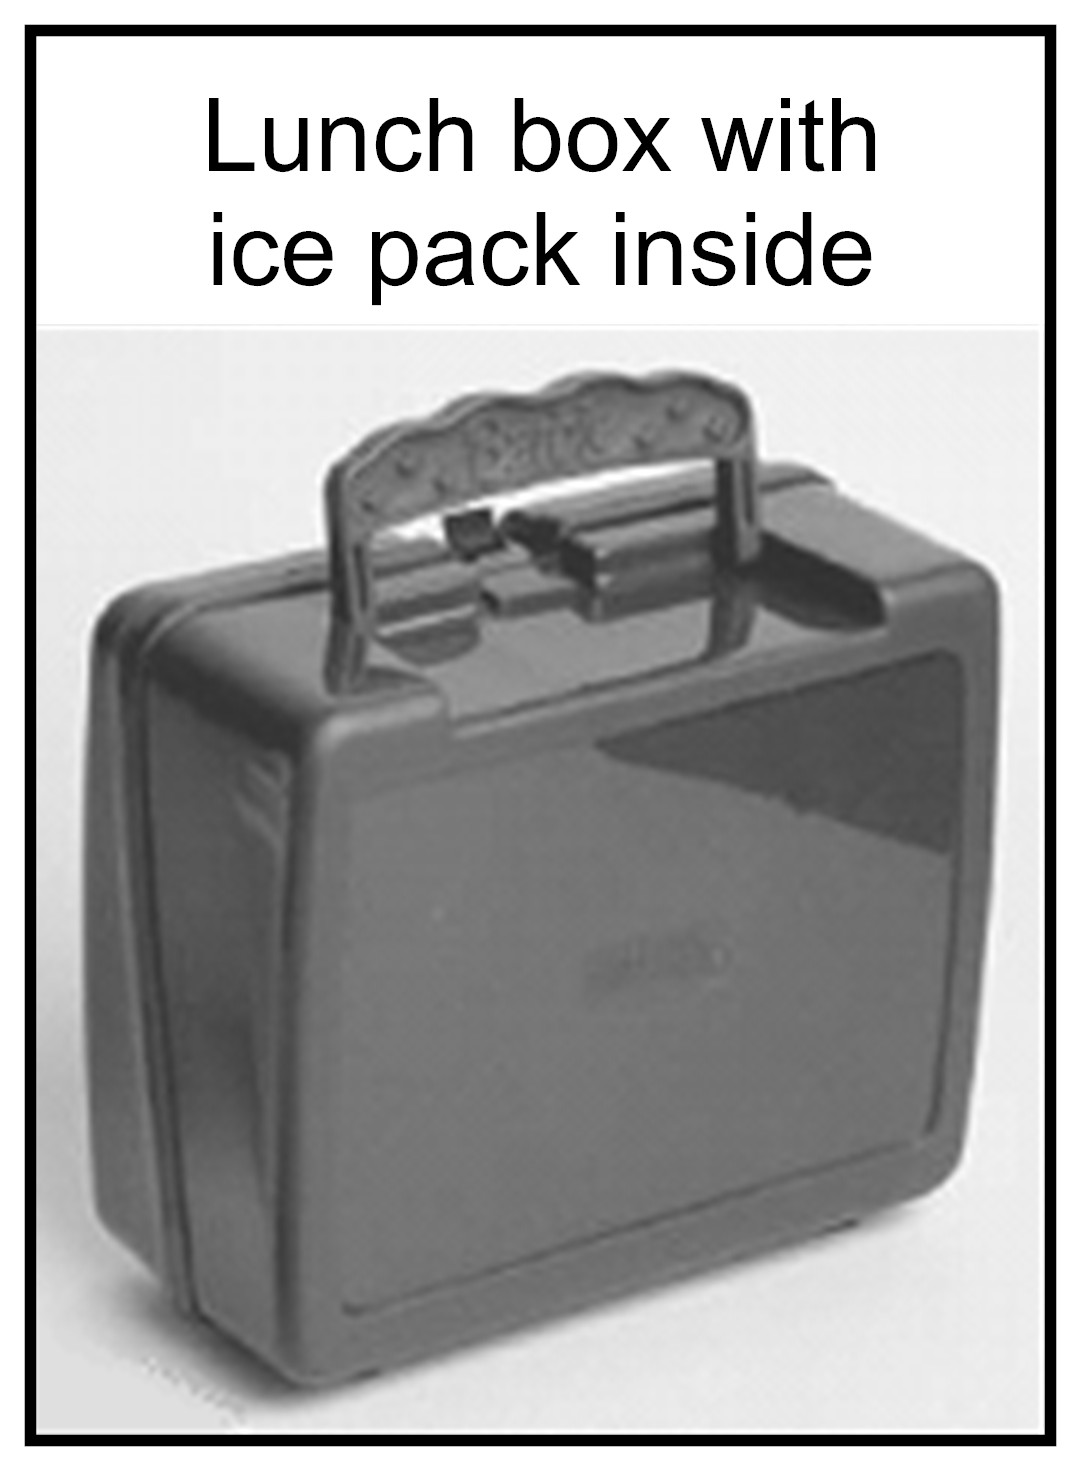
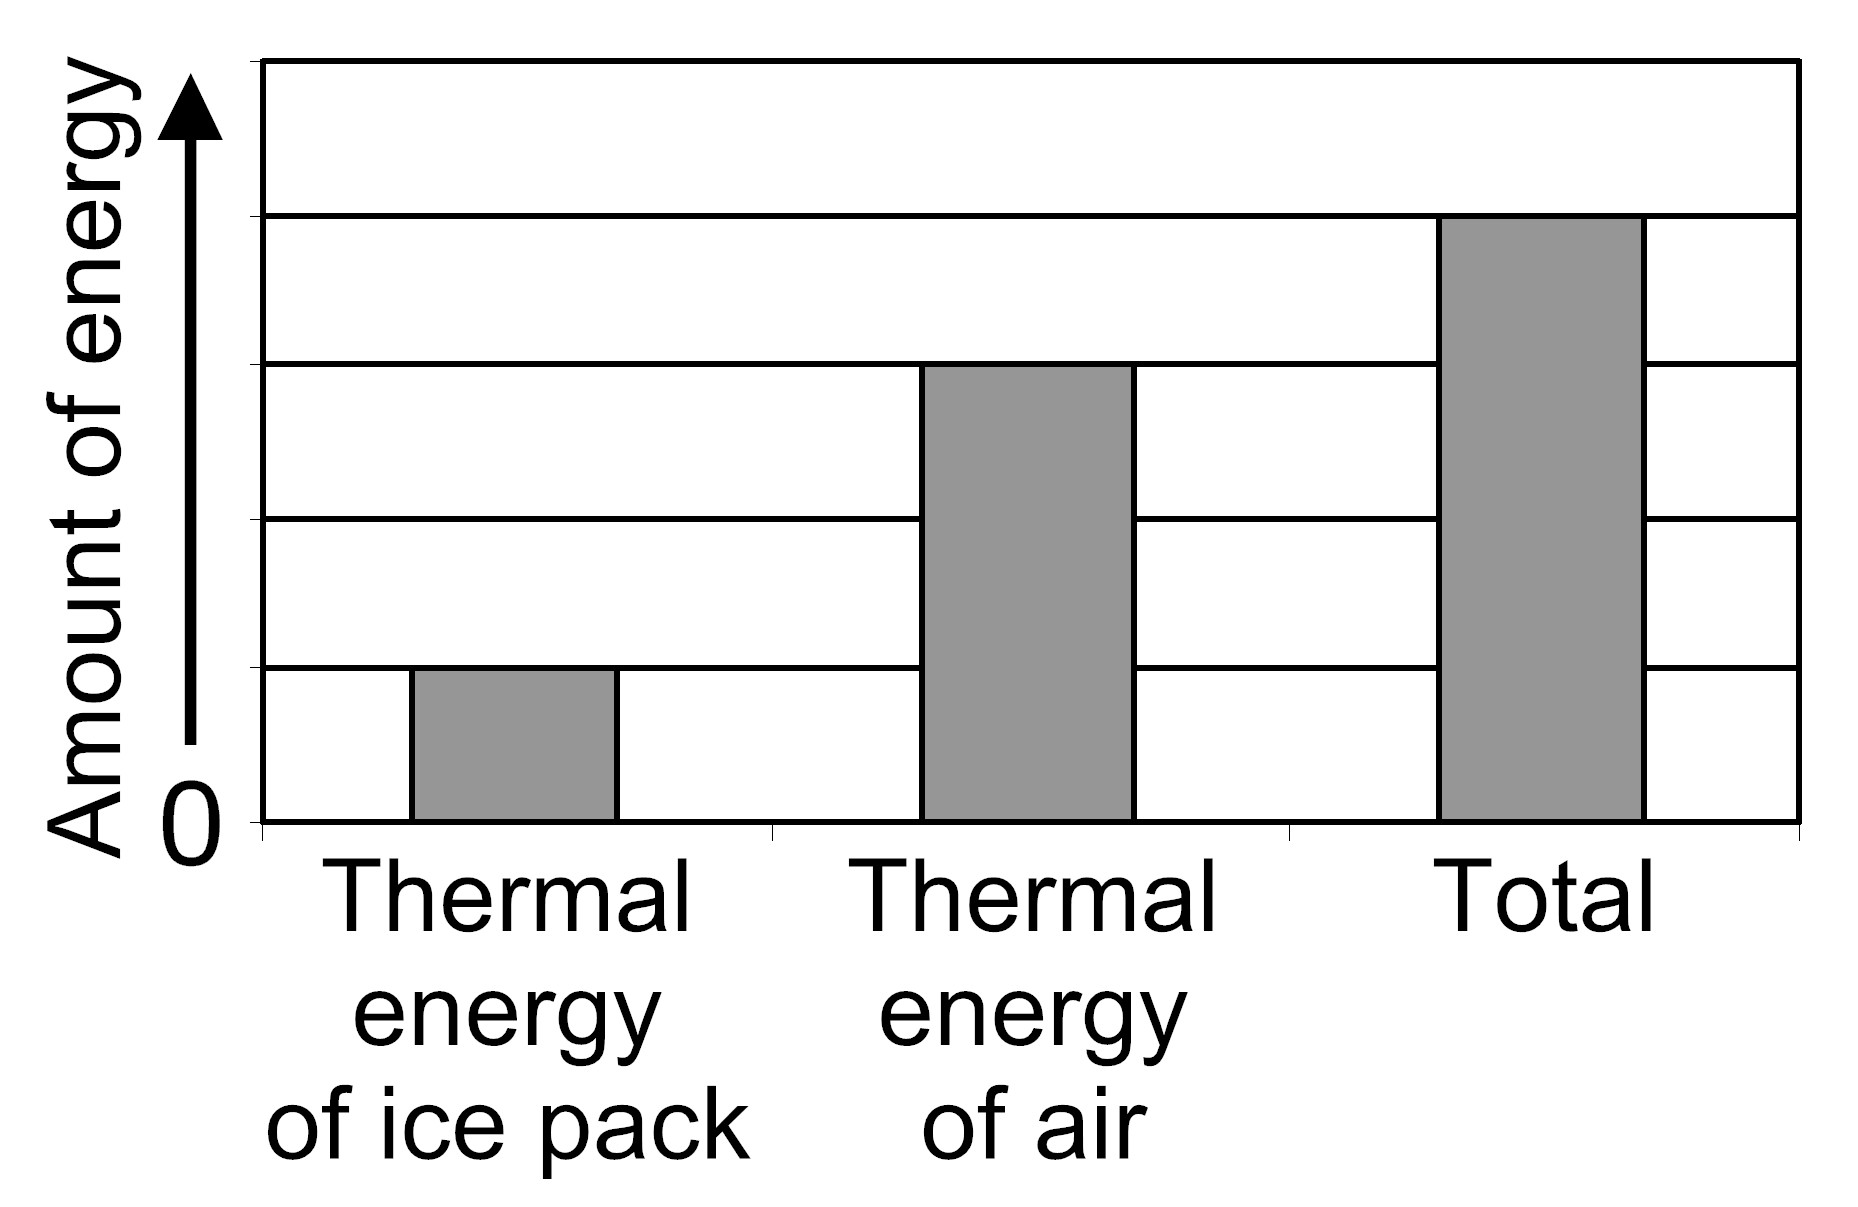
A person takes an ice pack out of the freezer and places it in a small empty lunch box. The person closes the lunch box. The following graph shows the thermal energy of the ice pack and the thermal energy of the air in the lunch box right after the person closes the box. The graph also shows the total amount of thermal energy (the sum of the amounts of thermal energy of the ice pack and the air in the lunch box).


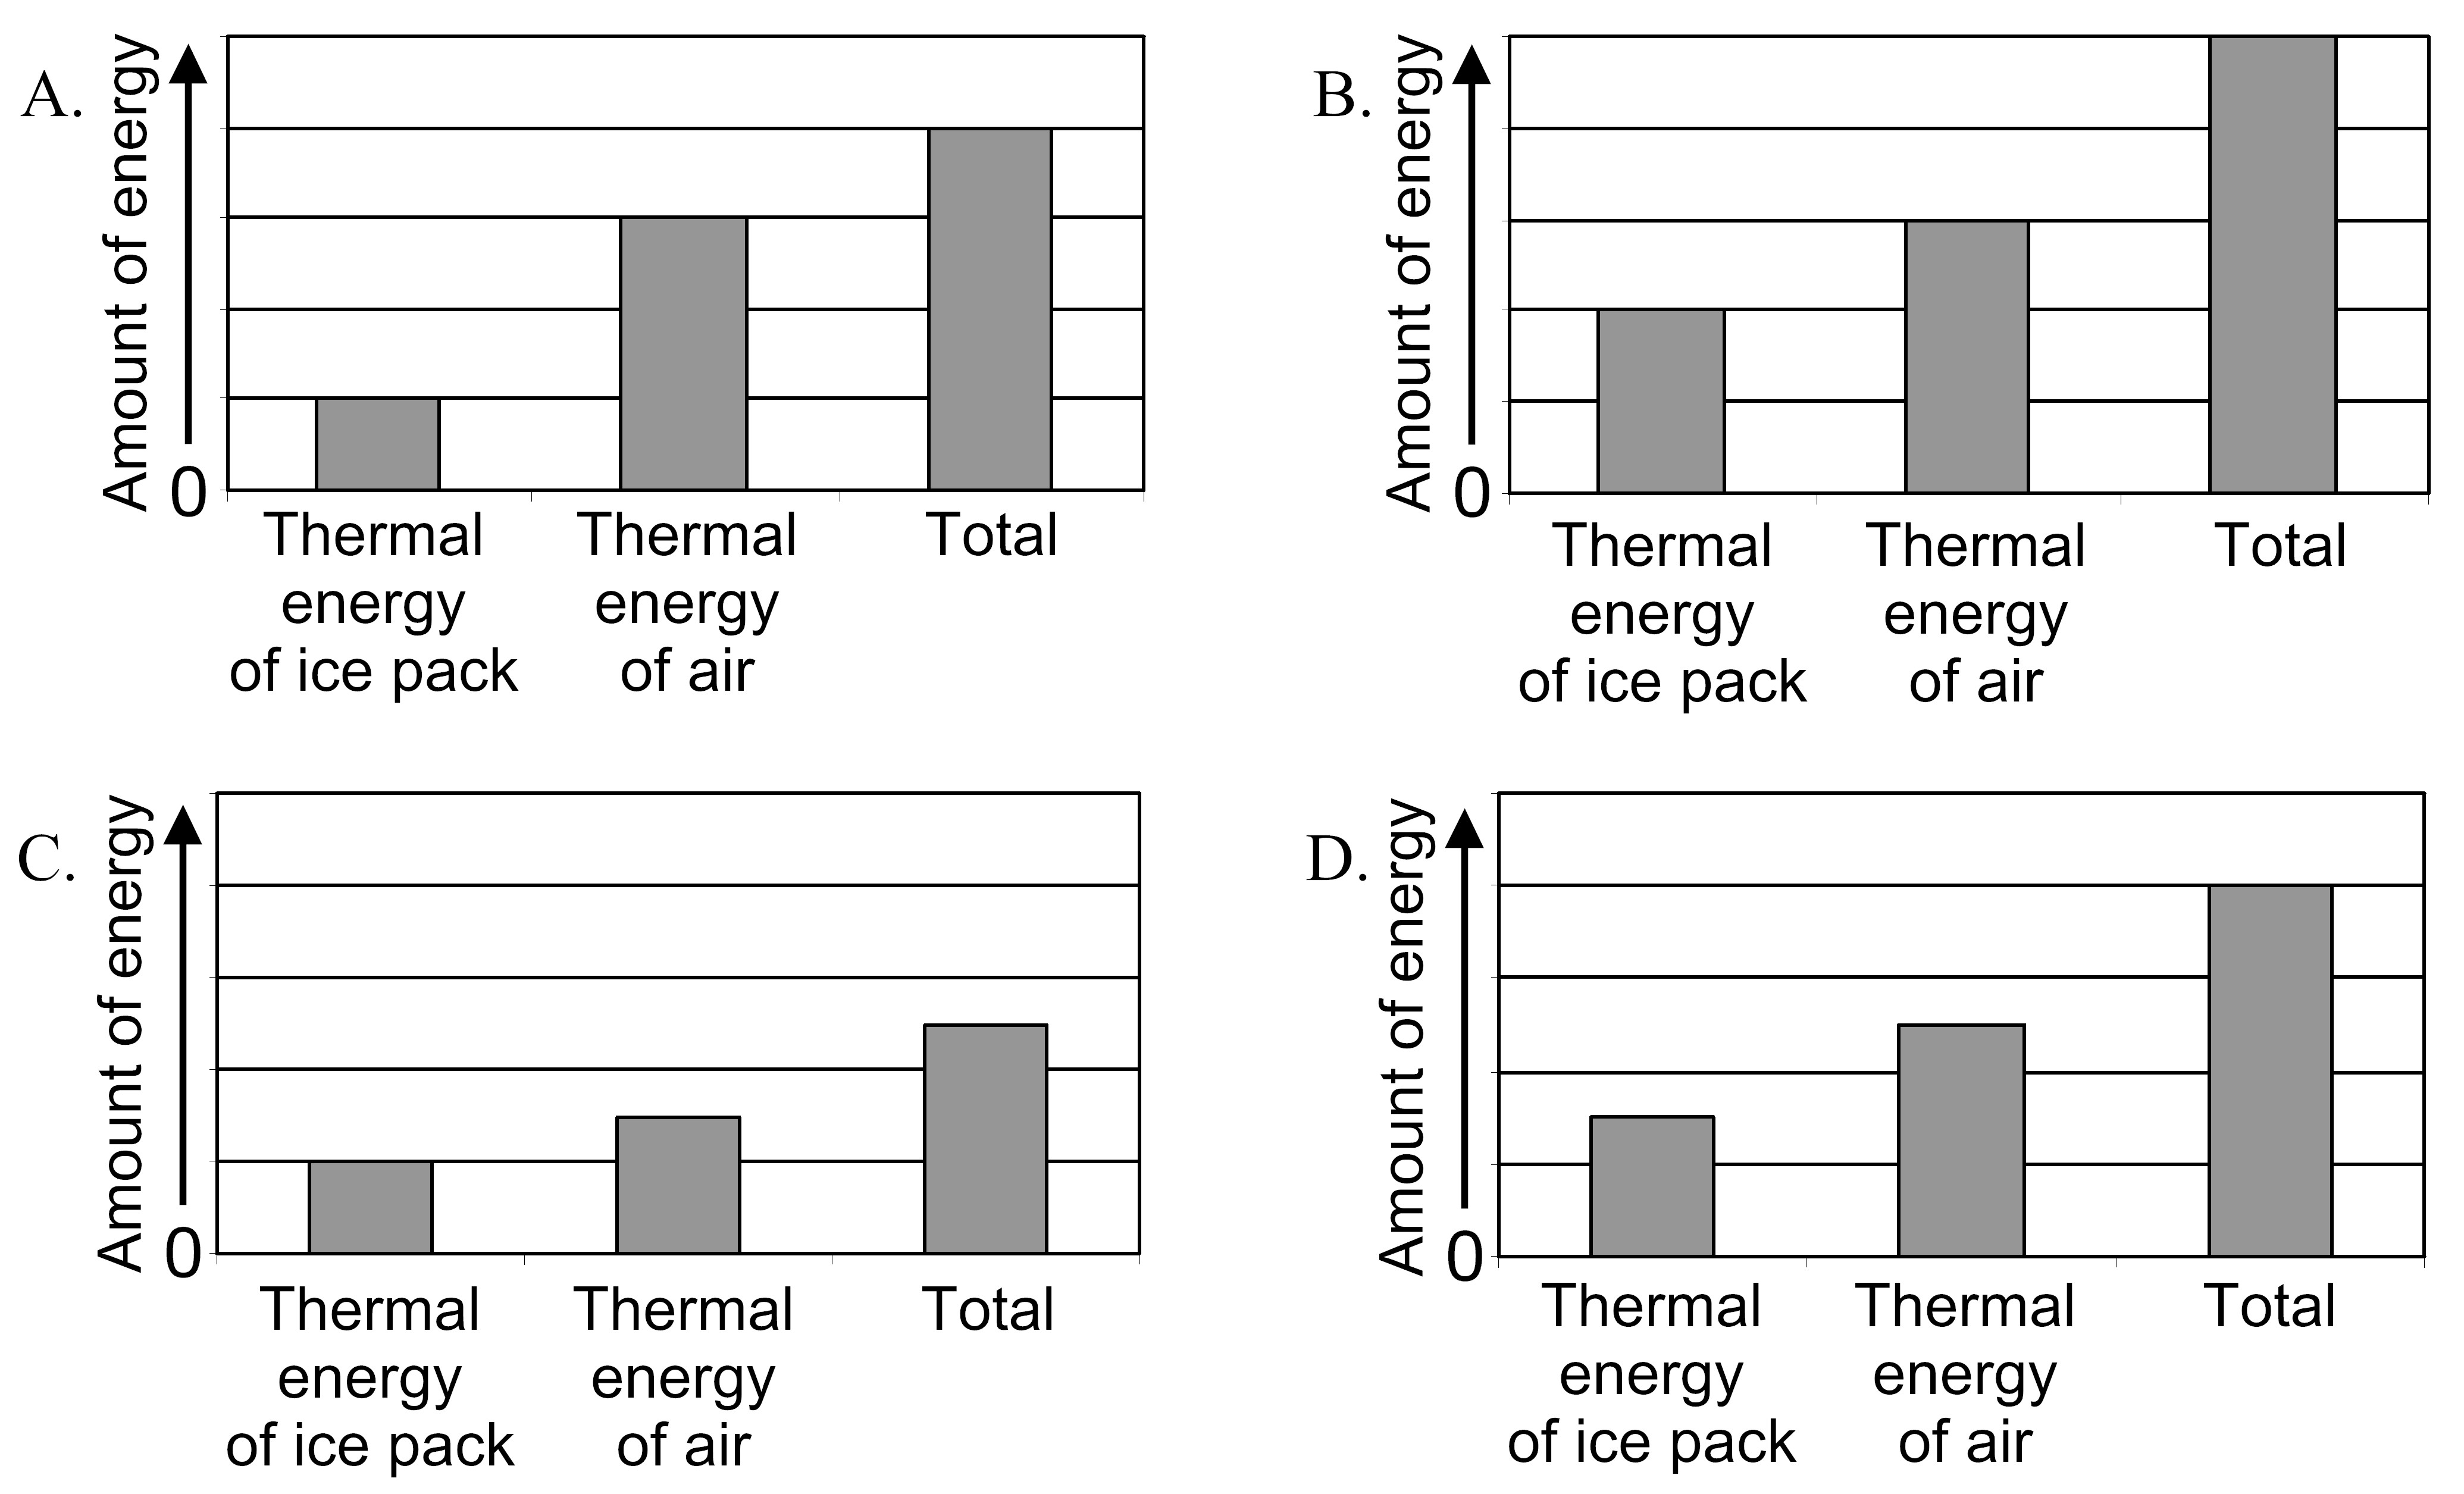
Two hours later, the ice pack will be a little warmer than it was at the beginning, and the air in the lunch box will be cooler than it was at the beginning. Which of the following graphs represents the thermal energy of the ice pack, the thermal energy of the air, and the total amount of energy when the ice pack is warmer and the air is cooler? (Assume that no energy is transferred into or out of the lunch box after it is closed.)

Answer Choice |
Overall |
Grades |
Gender |
Primary Language |
||||
|---|---|---|---|---|---|---|---|---|
| n = 1066 |
4–5 n = 0 | 6–8 n = 653 |
9–12 n = 413 |
Male n = 503 |
Female n = 539 |
English n = 932 |
Other n = 107 |
|
| A. | 20% | N/A | 20% | 18% | 19% | 20% | 19% | 22% |
| B. | 28% | N/A | 29% | 25% | 26% | 29% | 27% | 30% |
| C. | 24% | N/A | 23% | 24% | 22% | 25% | 24% | 21% |
| D. | 29% | N/A | 27% | 32% | 32% | 25% | 29% | 27% |

